It’s been a long while since I have found the time to work on my blog – I have not been as motivated to write trip reports in recent years as I once was.
I will try to post some pictures on trips and expeditions I have made throughout the last 2 years over the next few months. For wilderness areas like Greenland, I will not add any trip descriptions or maps. Many previously undocumented spots I have included in previous reports seem to have been picked up by organisations, which gives me mixed feelings: on the one hand, I don’t want to deny other people going to these places and enjoy their splendour – on the other hand it does just not feel right that some of those unspoilt places start to appear on social media (including geotags), possibly provoking an explosion in visitor numbers.
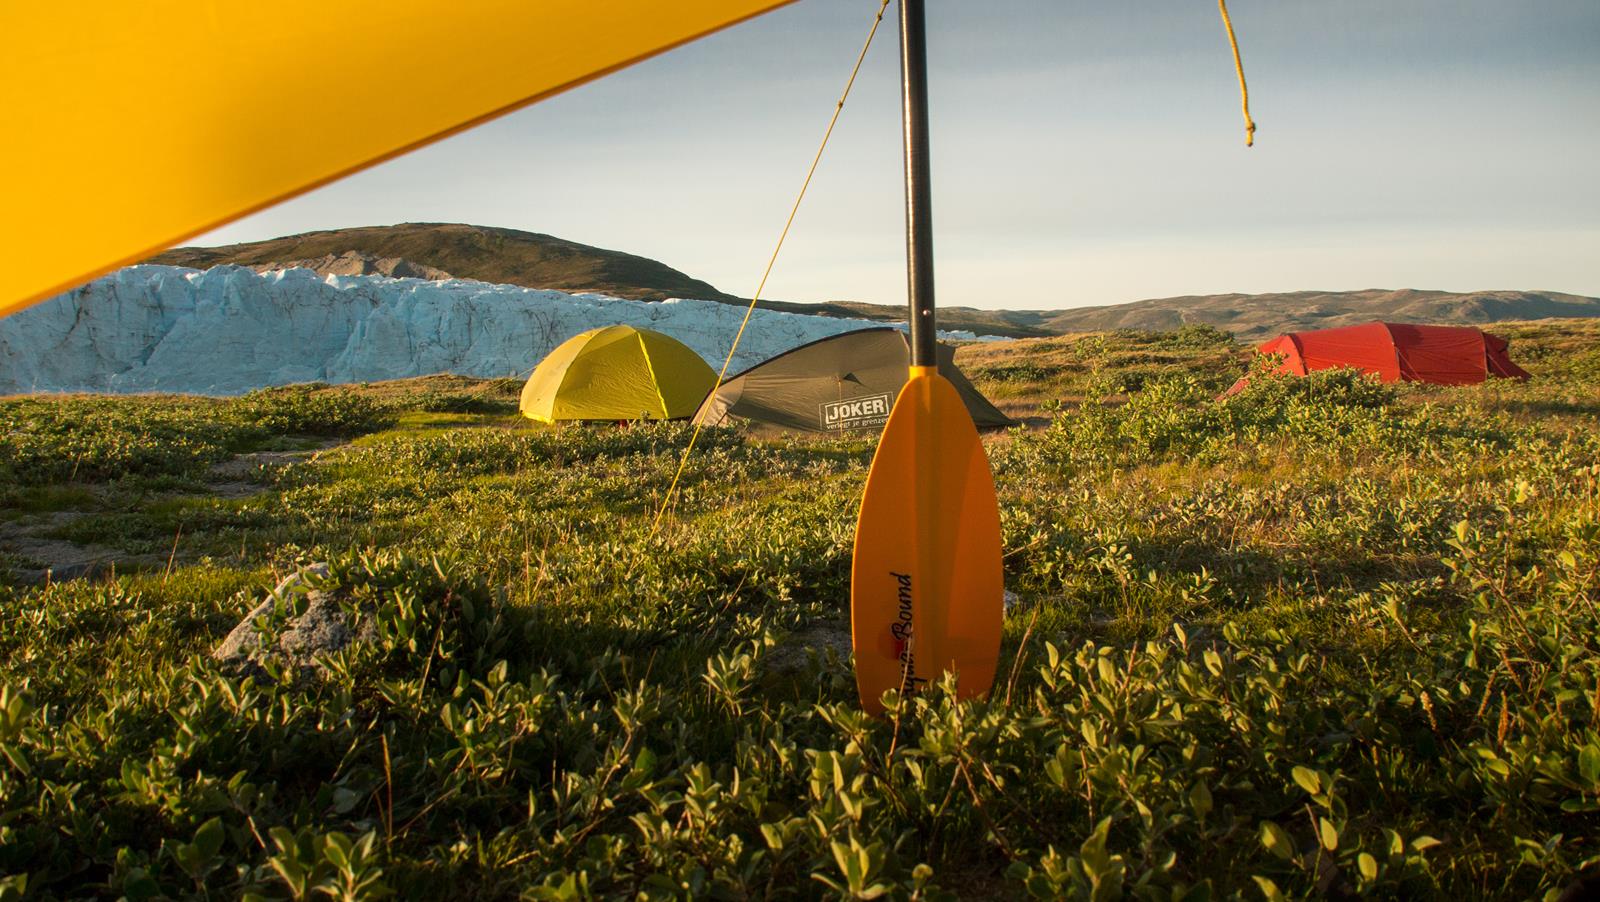
Below, you can find a selection of pictures from a 2-month hiking and packrafting trip in Greenland I made in the summer of 2018, and consisting of 3 parts:
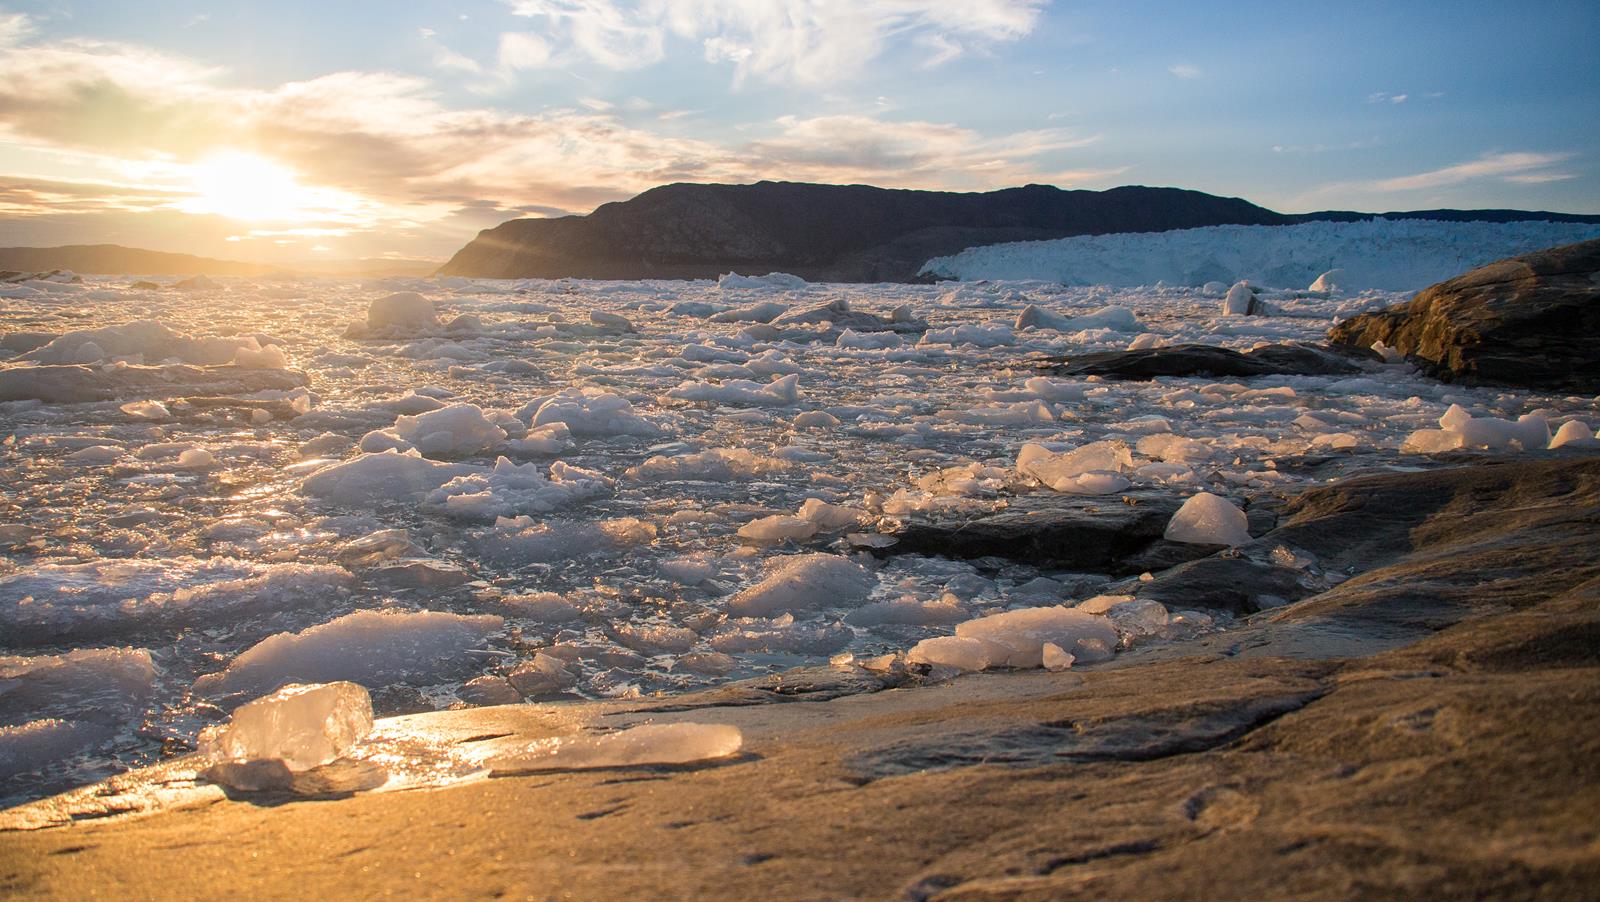
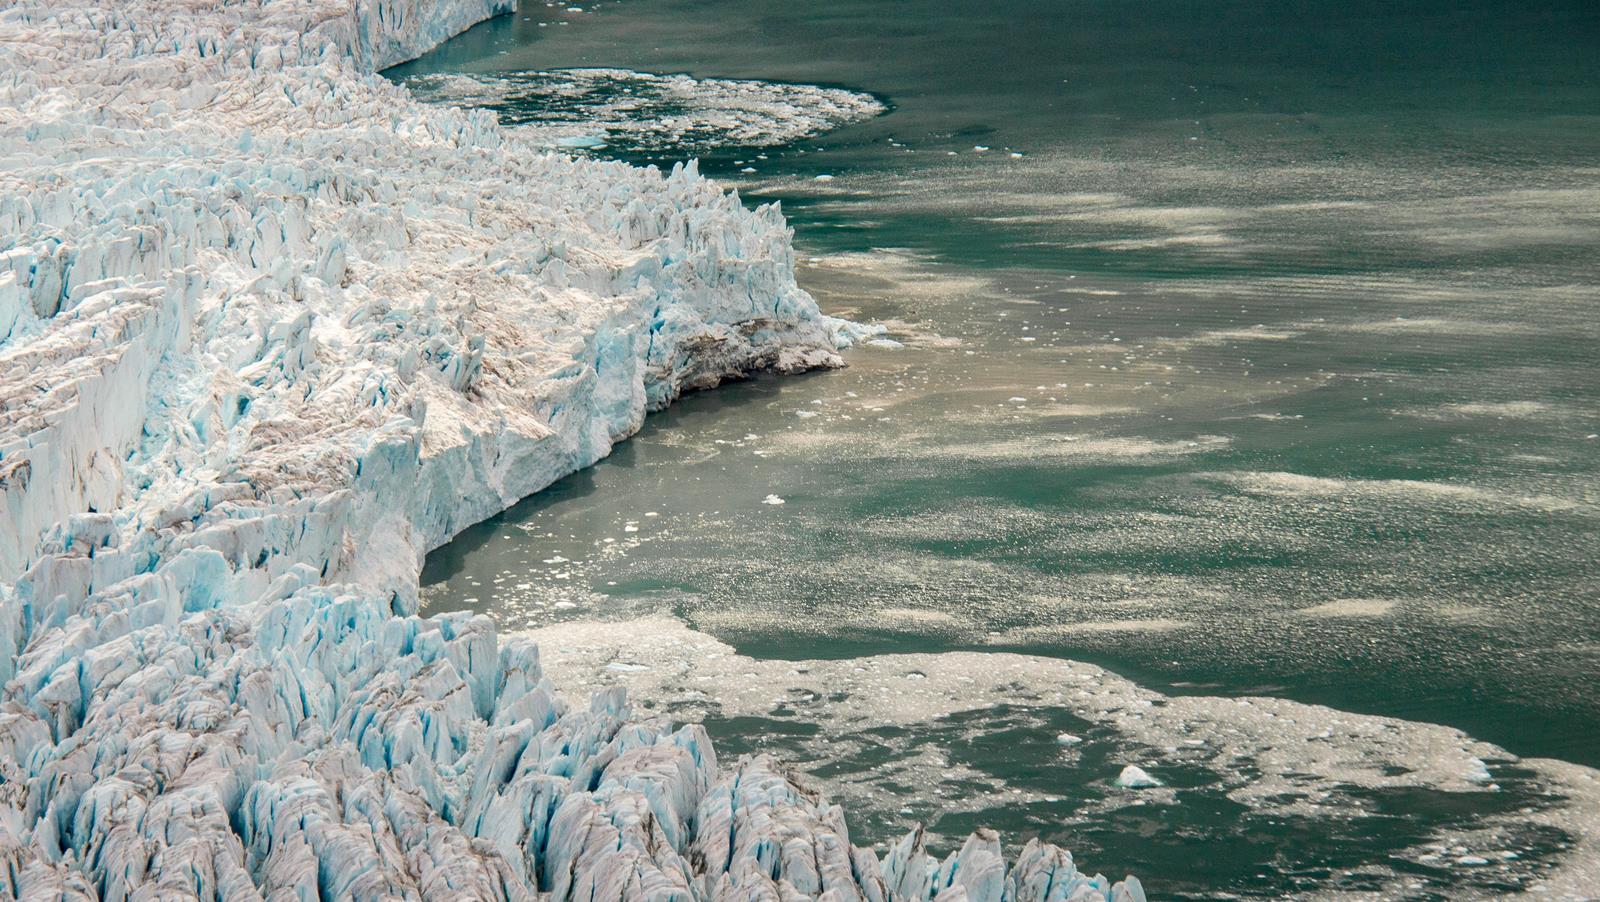
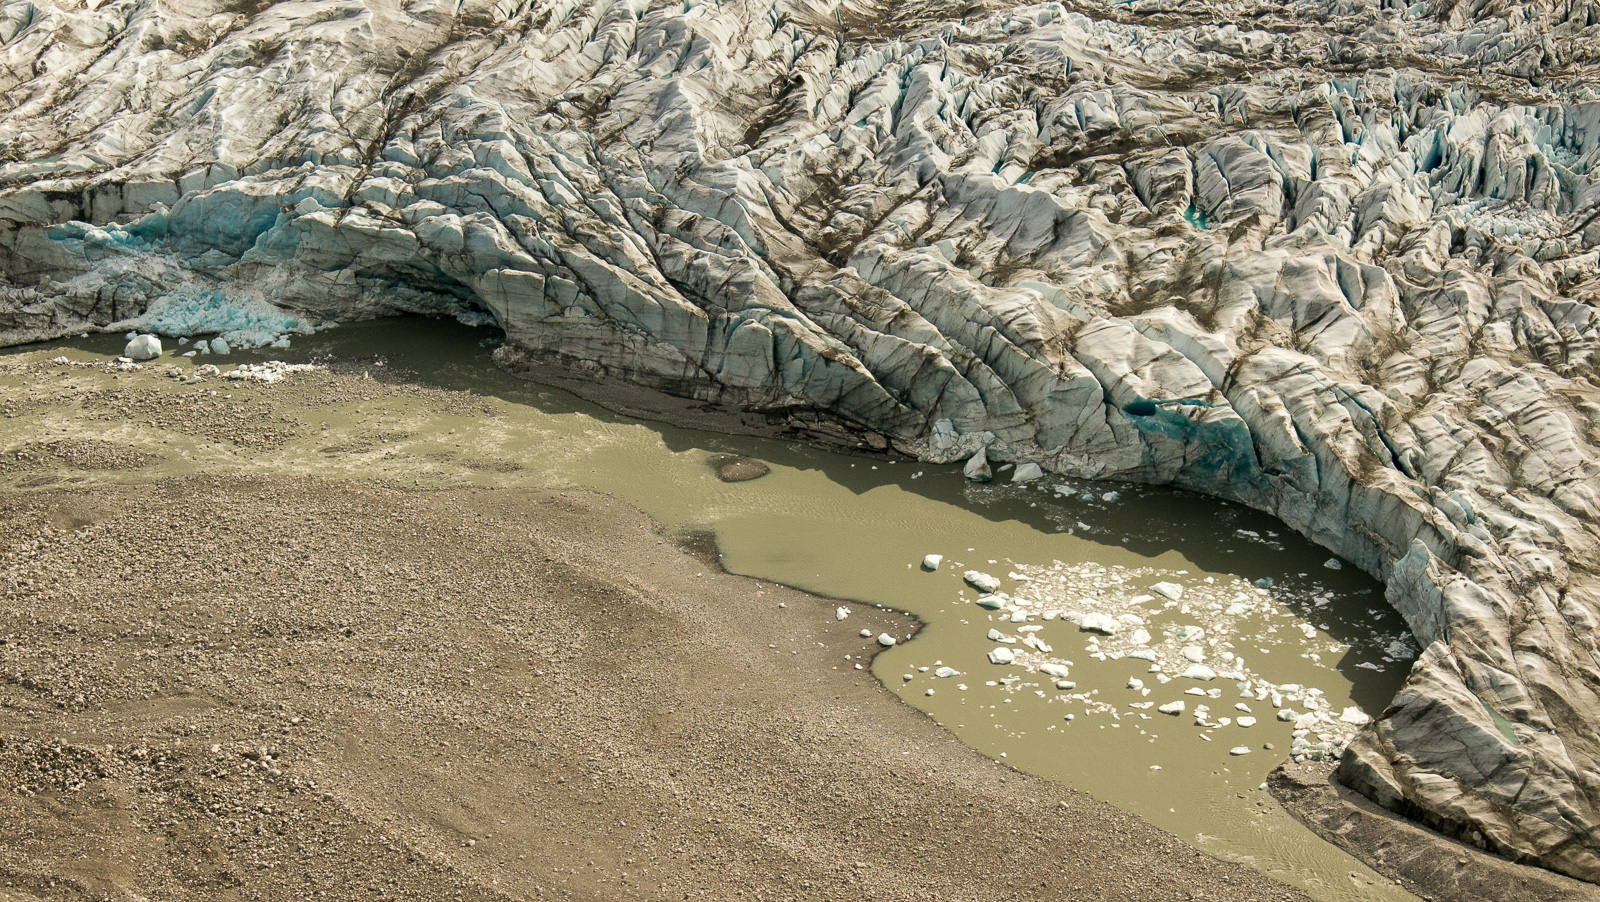
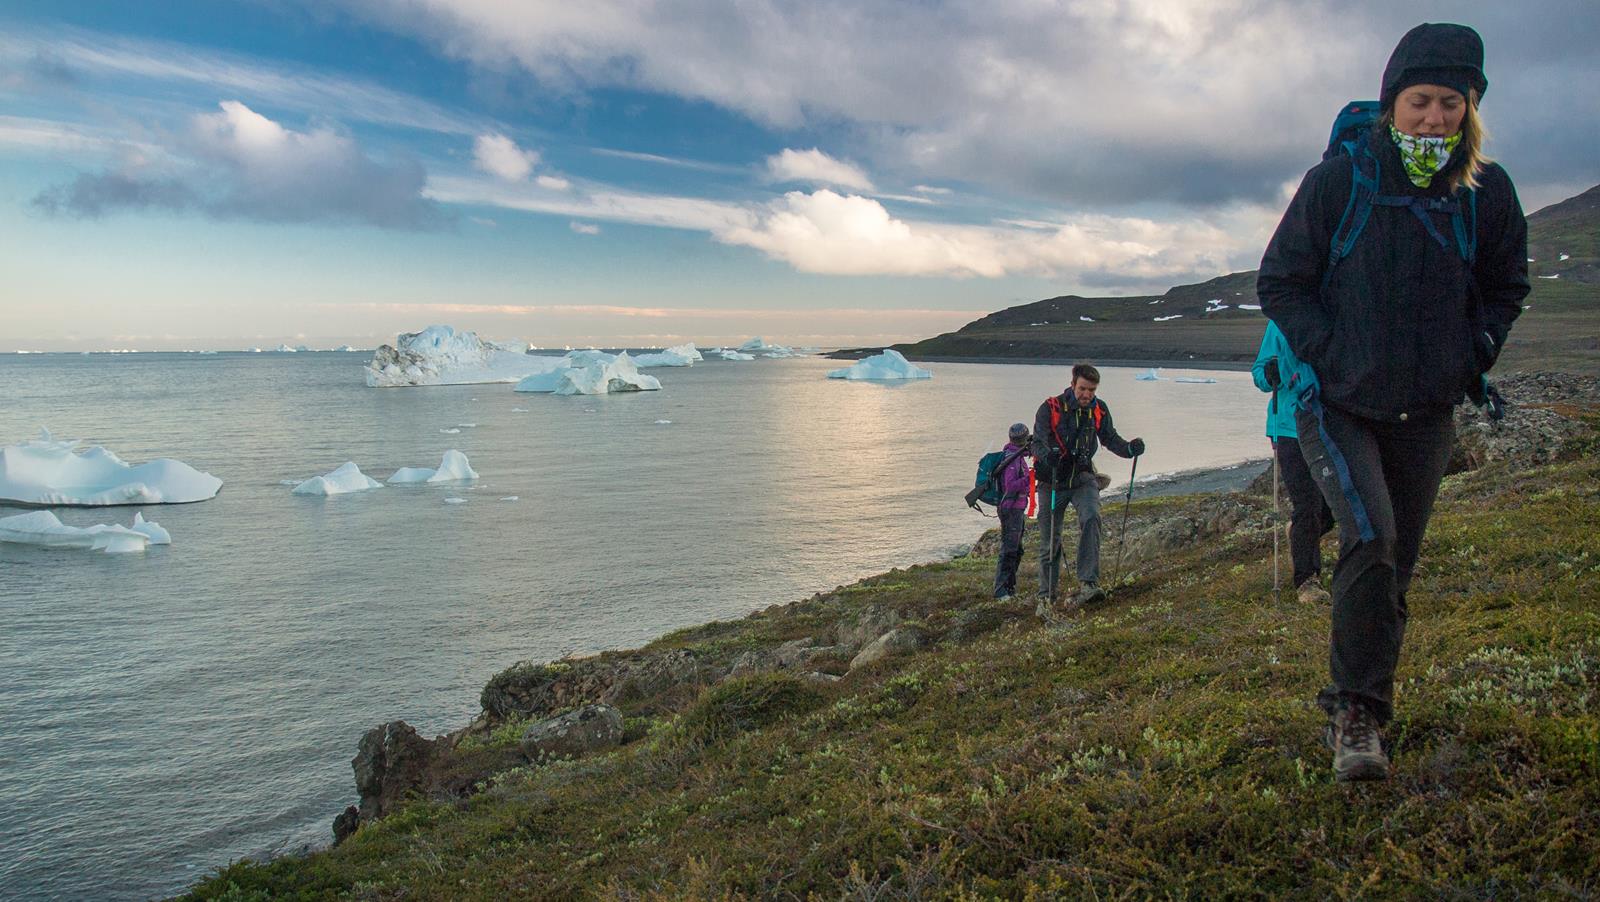
– Part 1: 17 days with Lien, from Qasigiannquit to Eqi Glacier, along the coast line of the Disko Bight and towards some spectacular outlet glaciers of the Ice Sheet
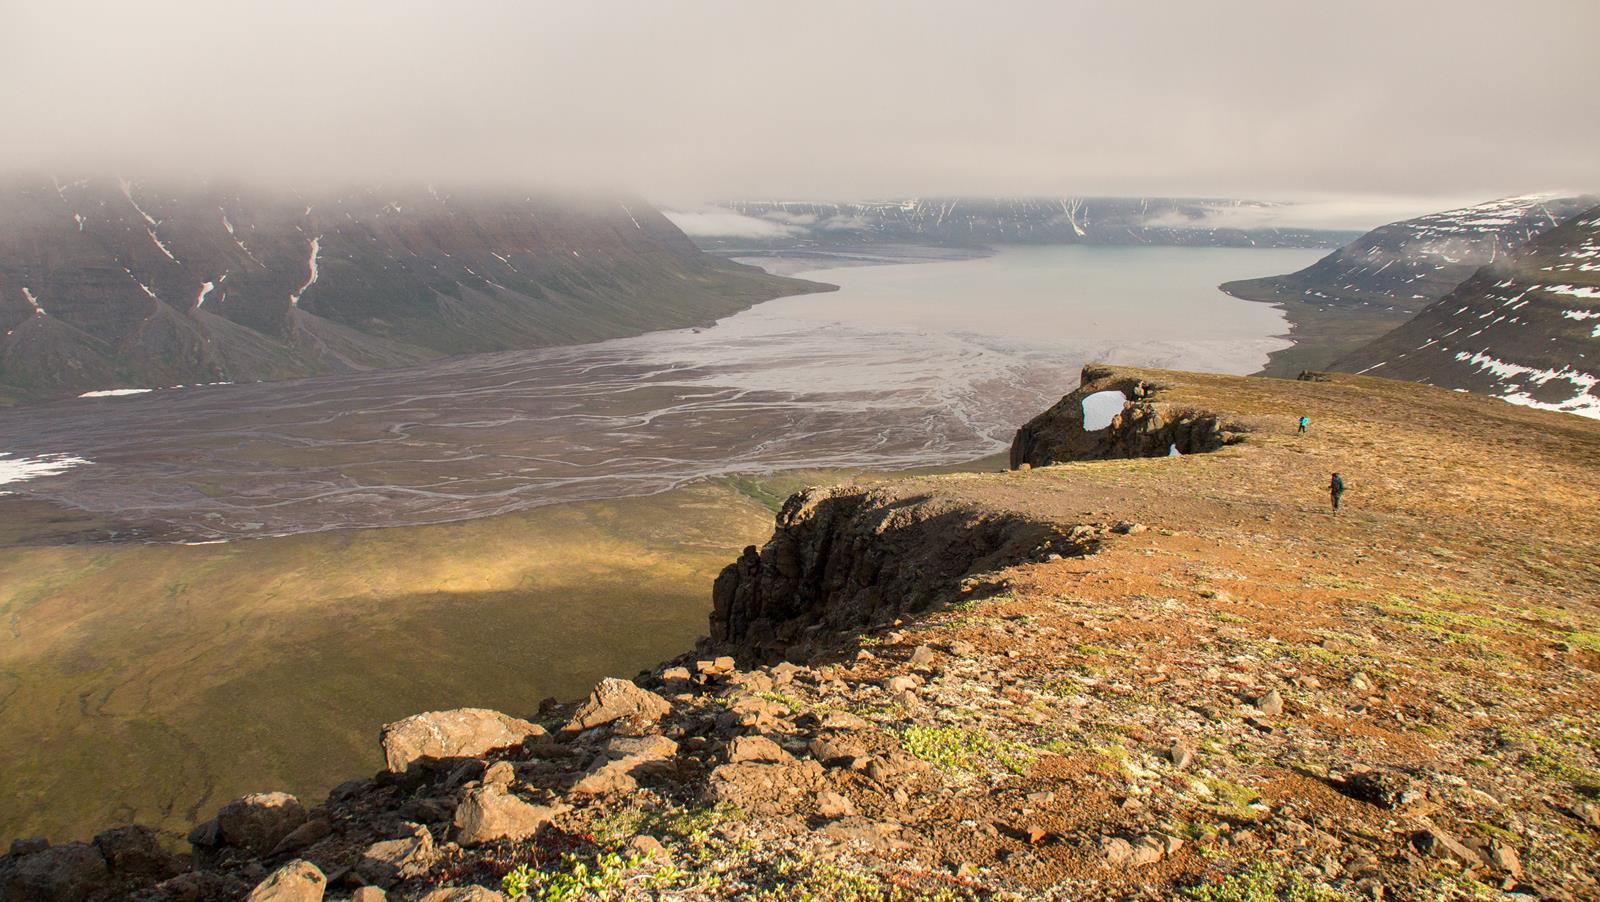
– Part 2: 16 days solo and in full autonomy on the Eastern Nuussuaq peninsula
– Part 3: 18 days recon and guiding on Mellemlandet en John Dahl Land in South Greenland
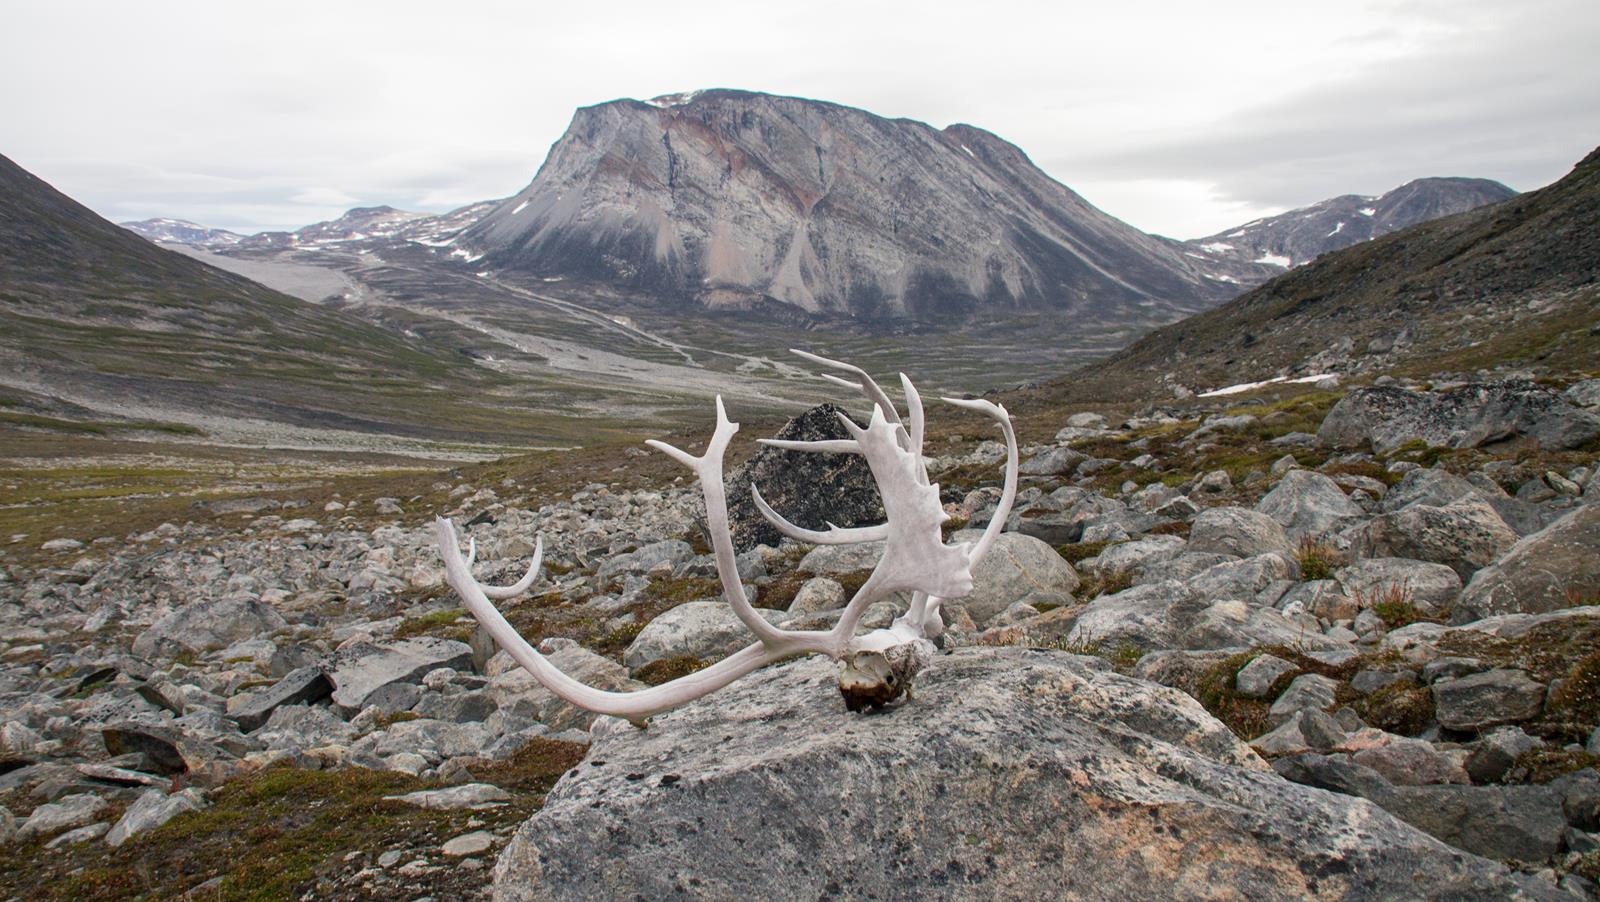
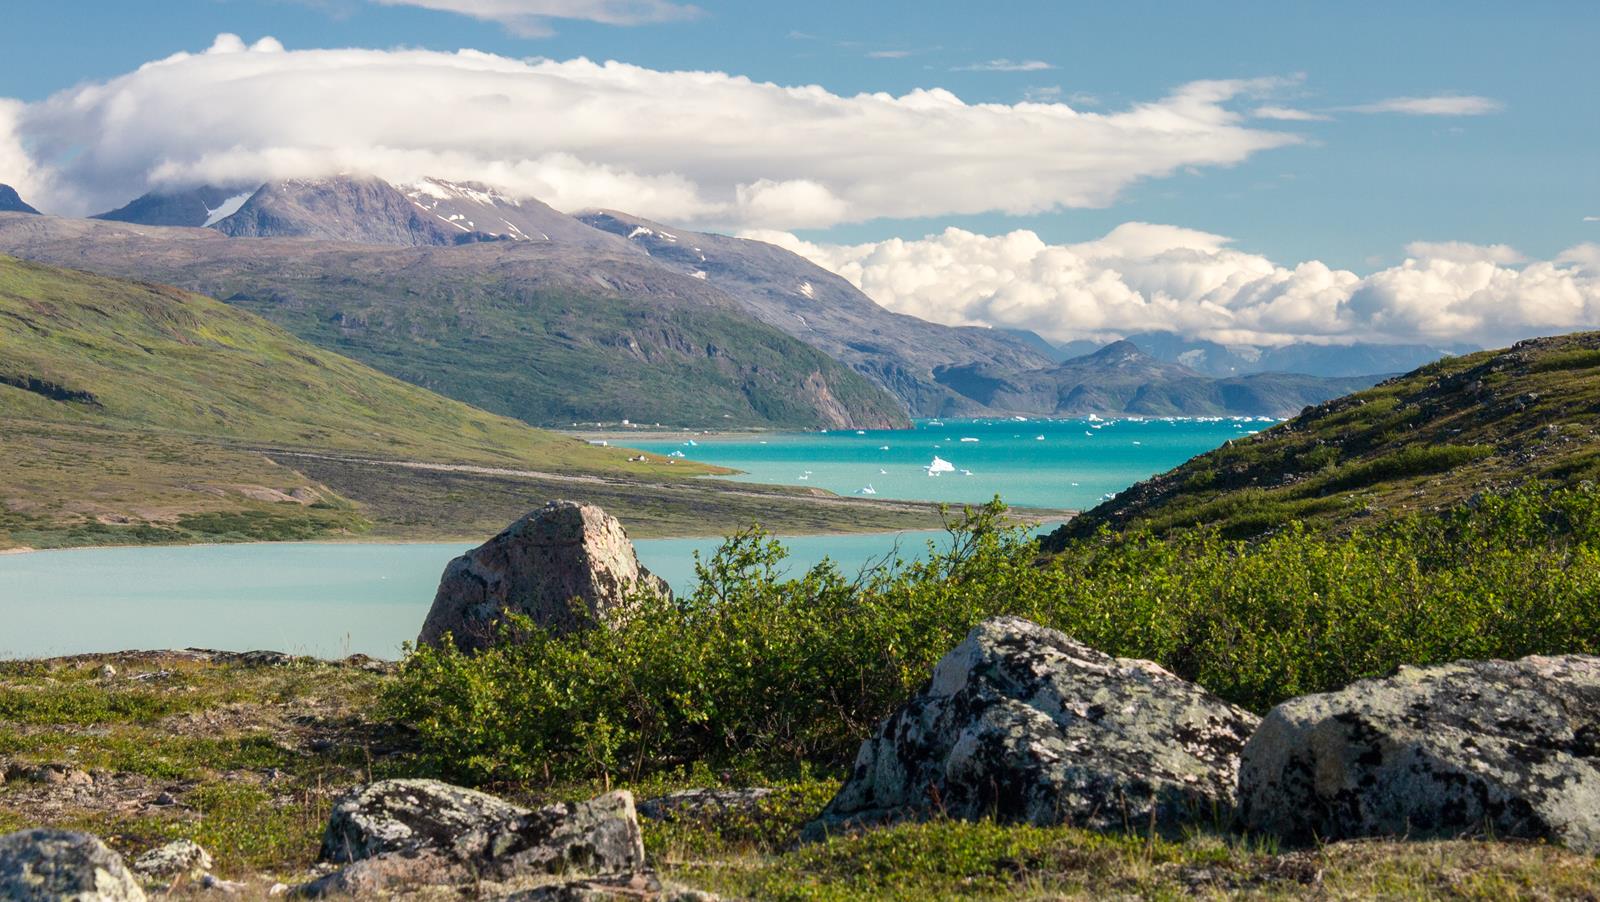
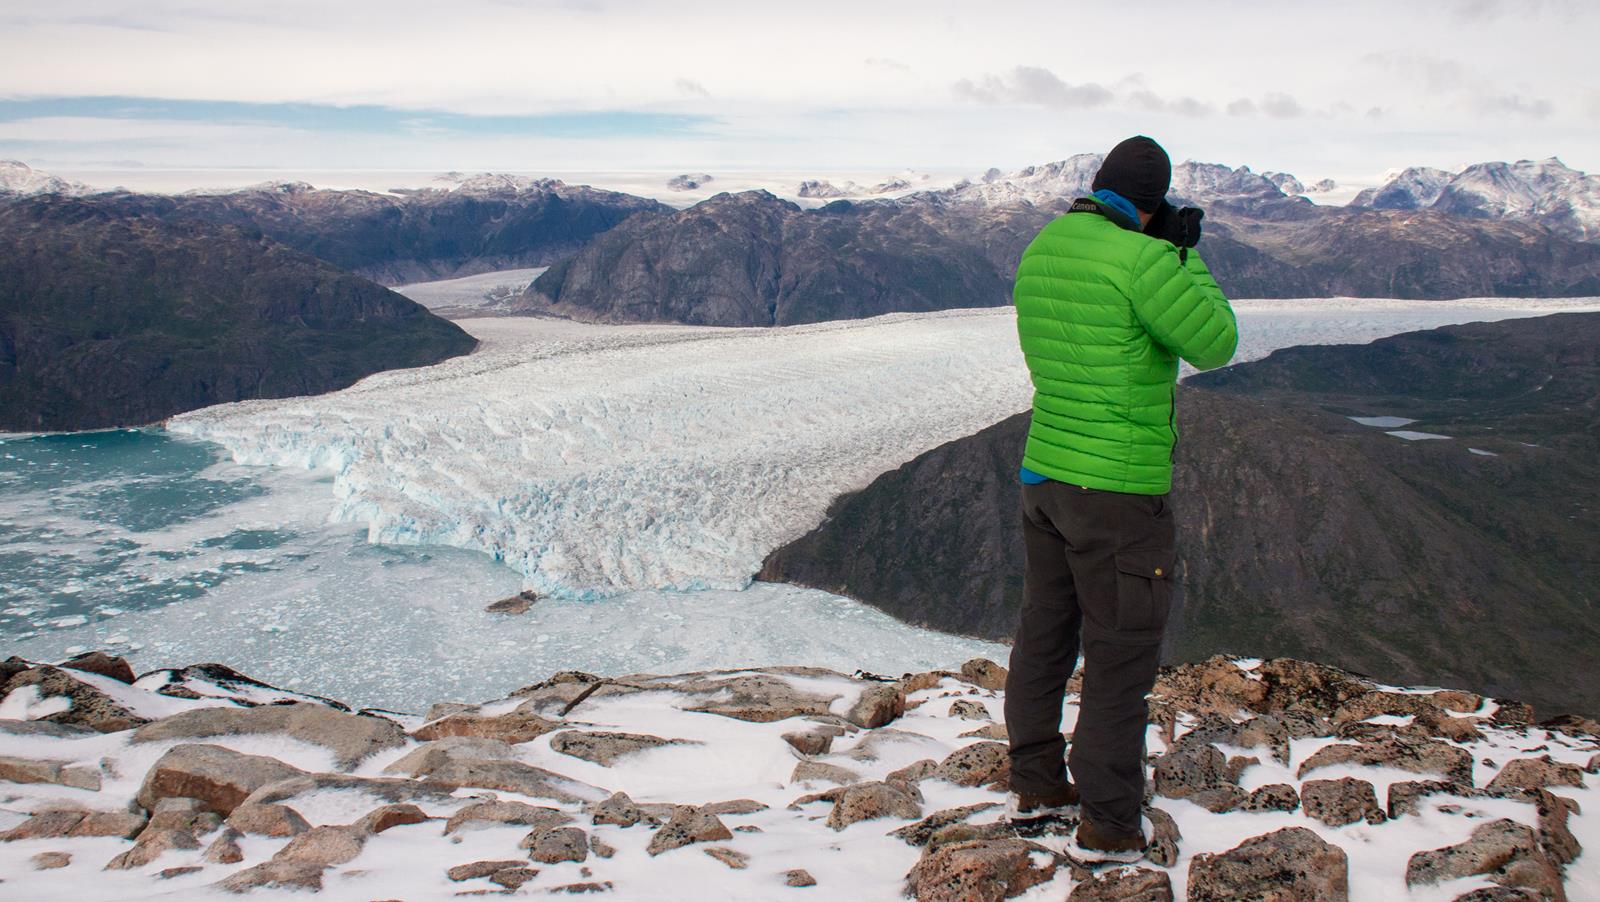
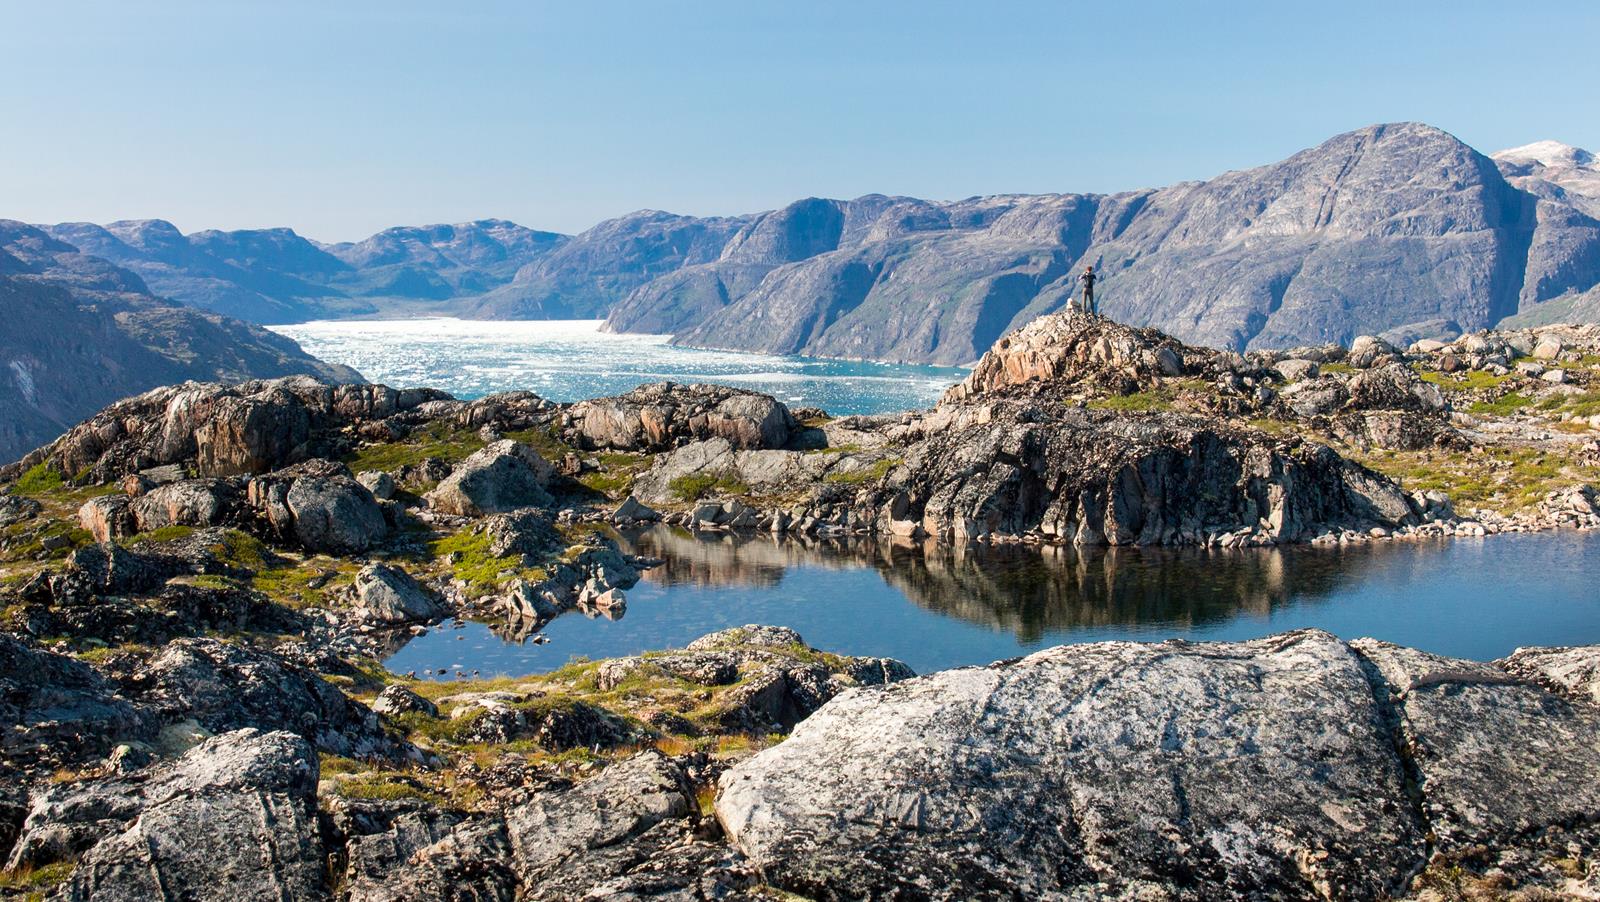
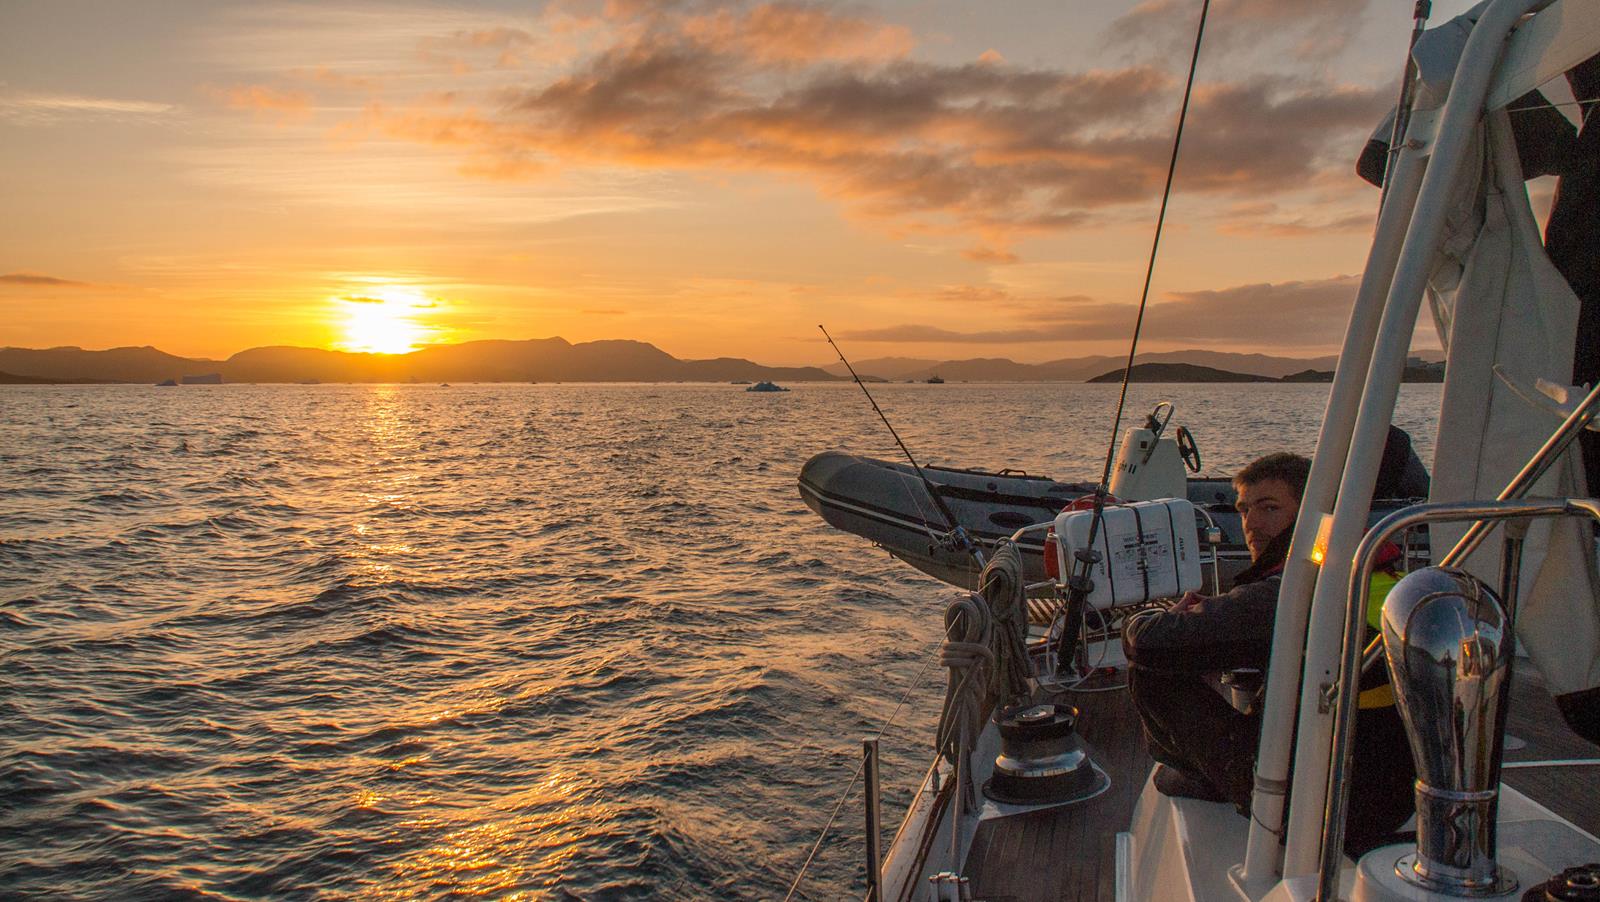
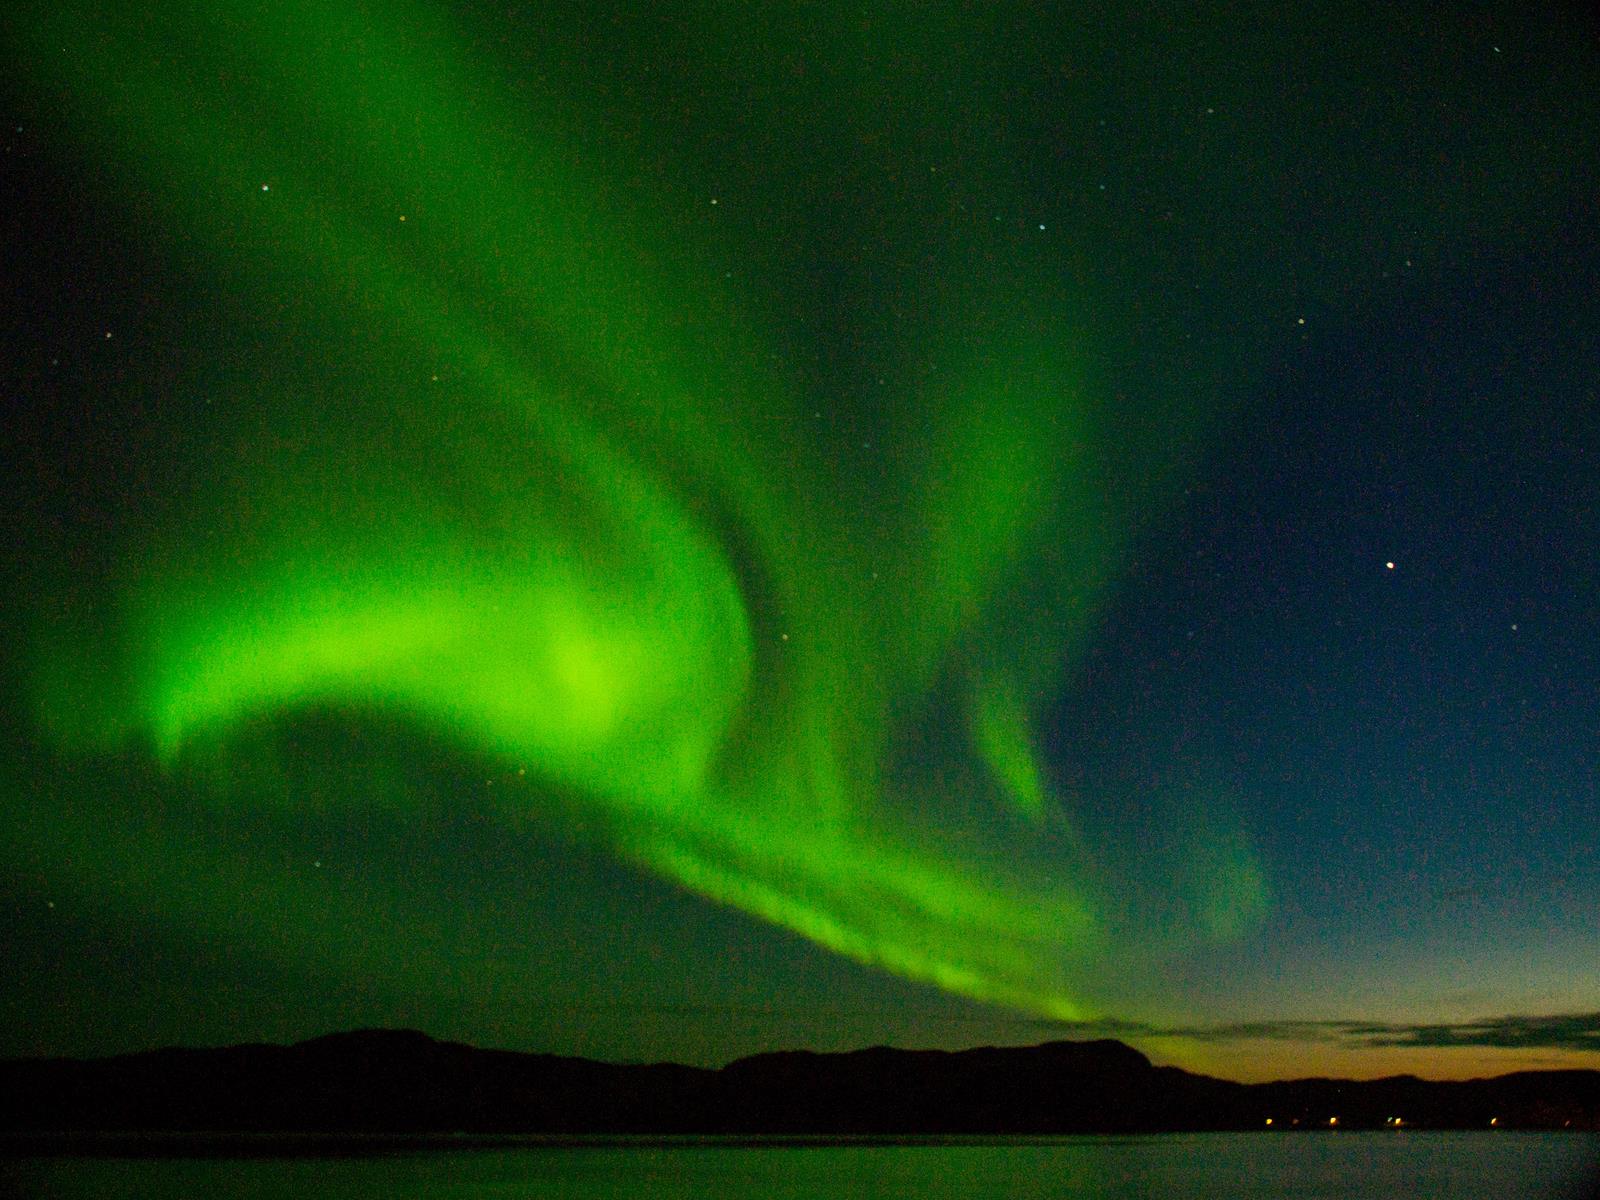
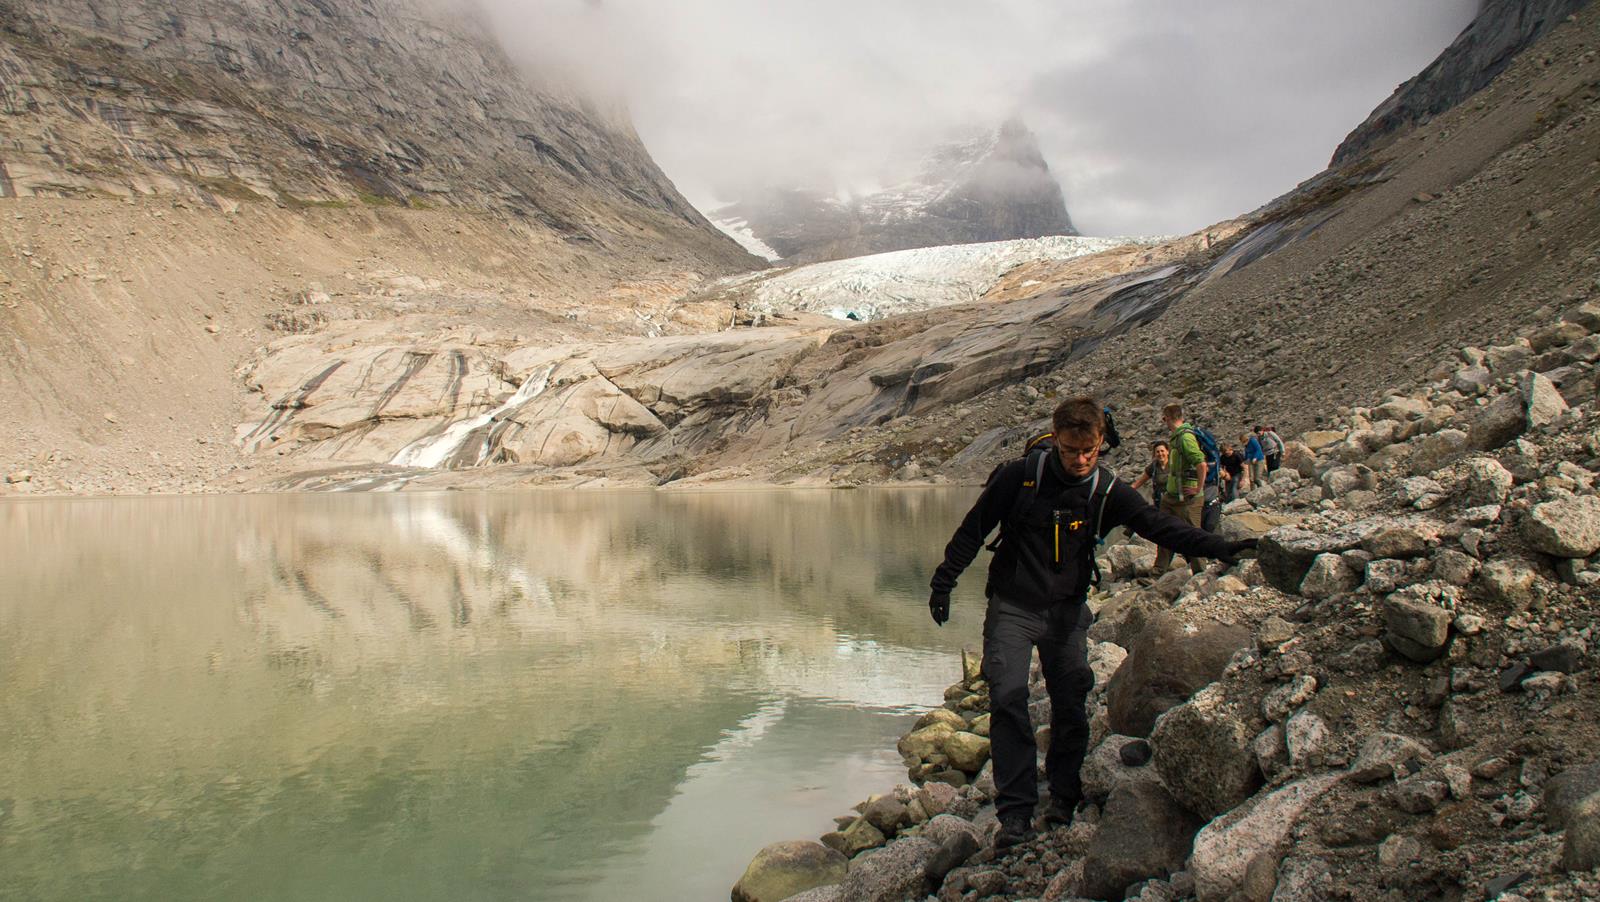
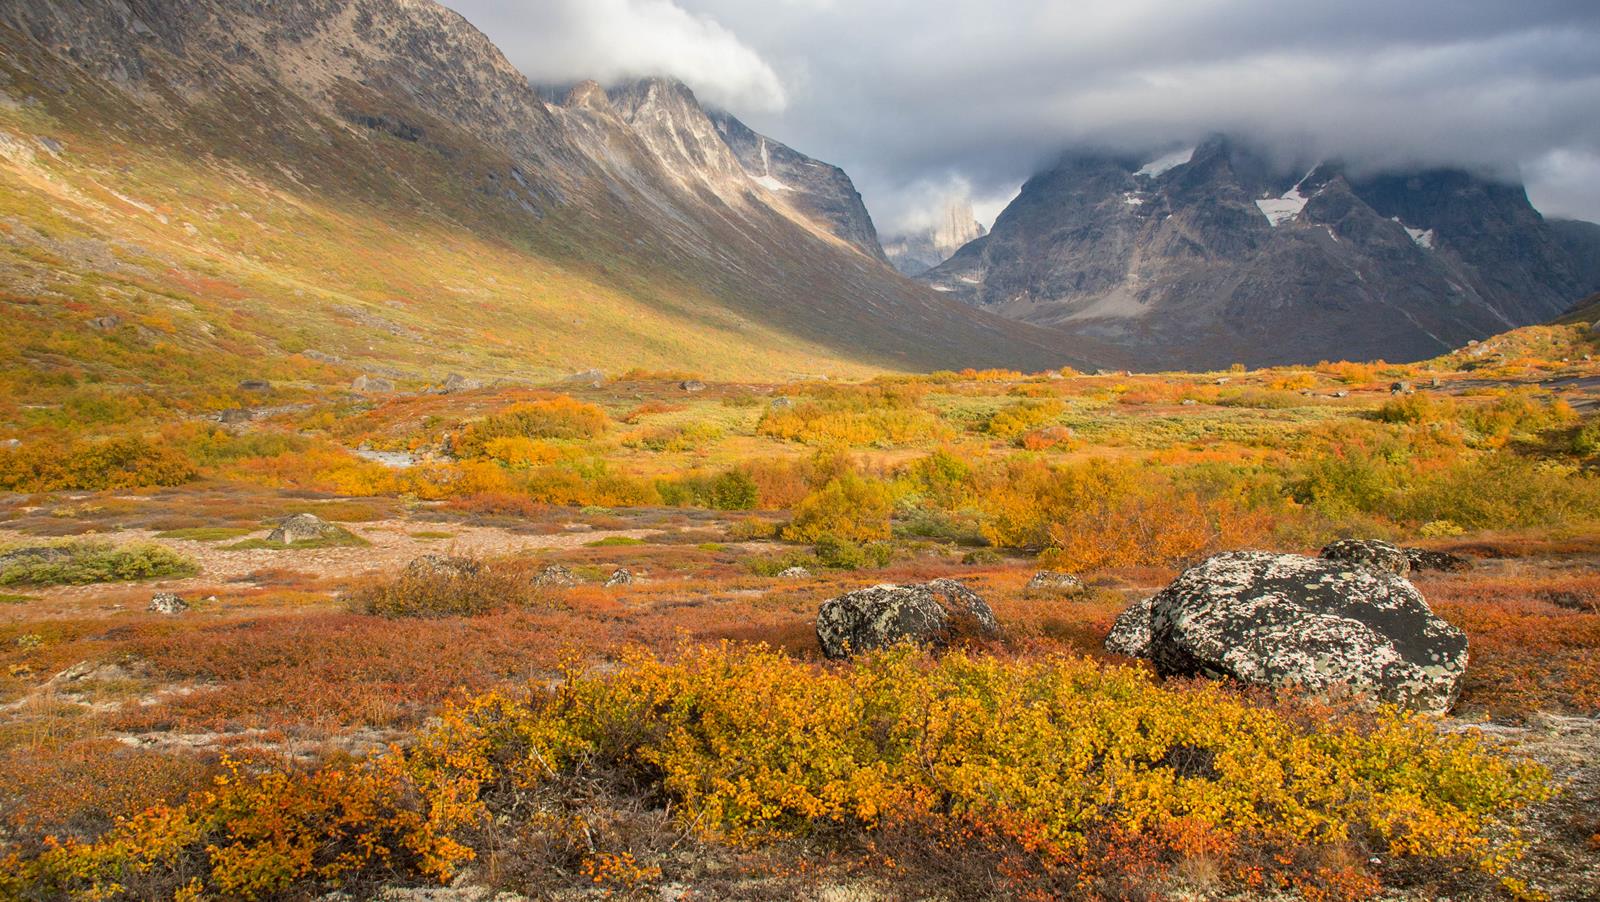
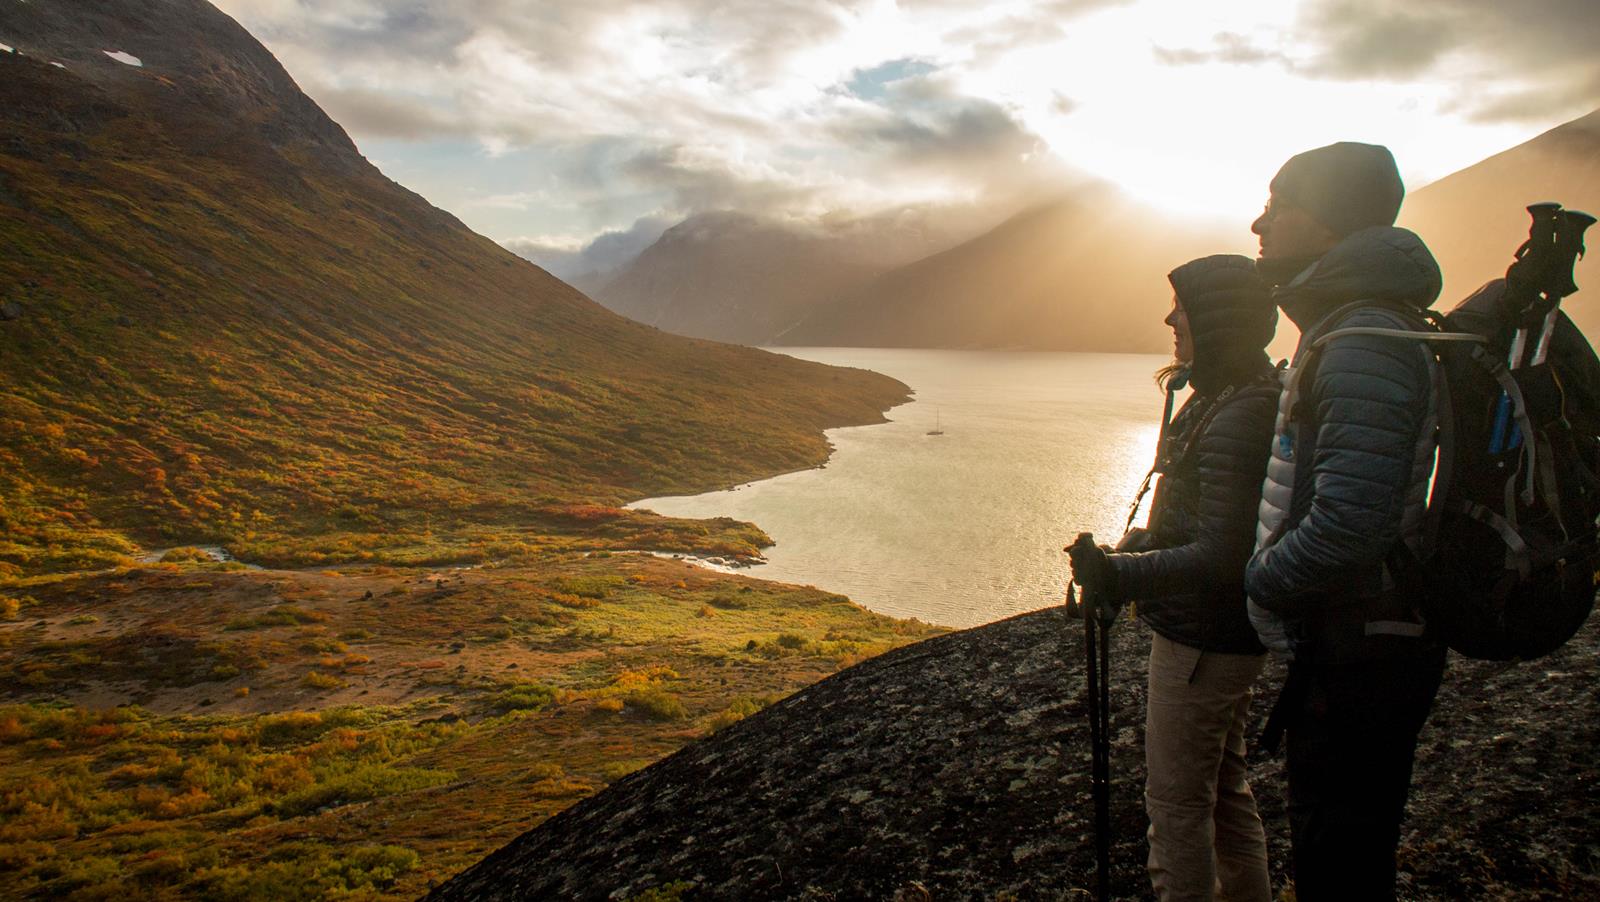
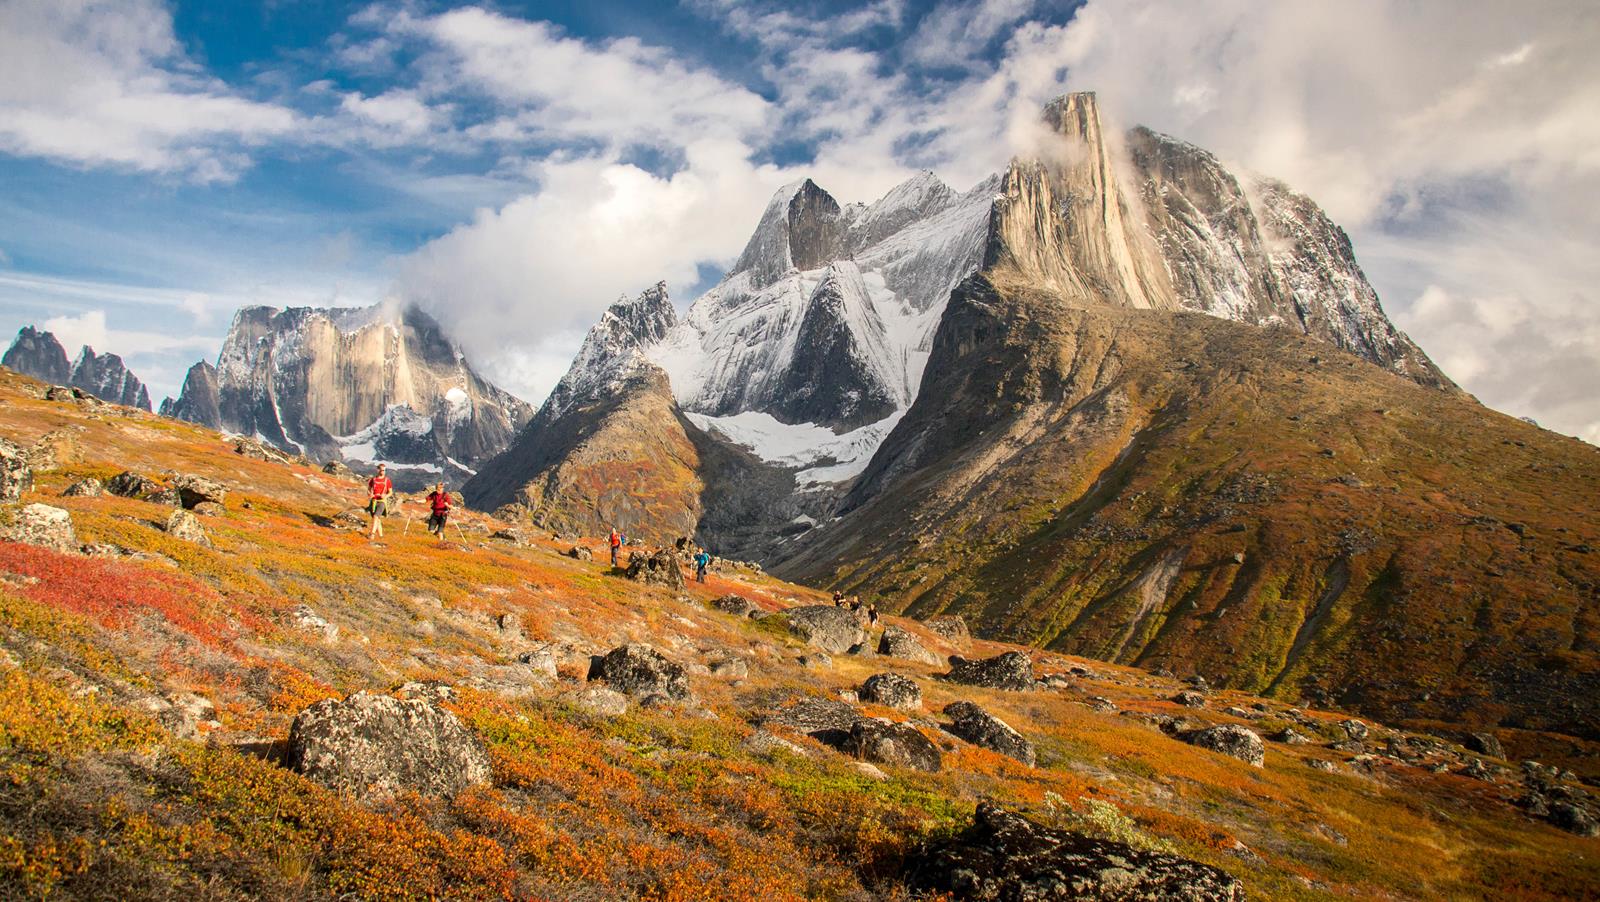
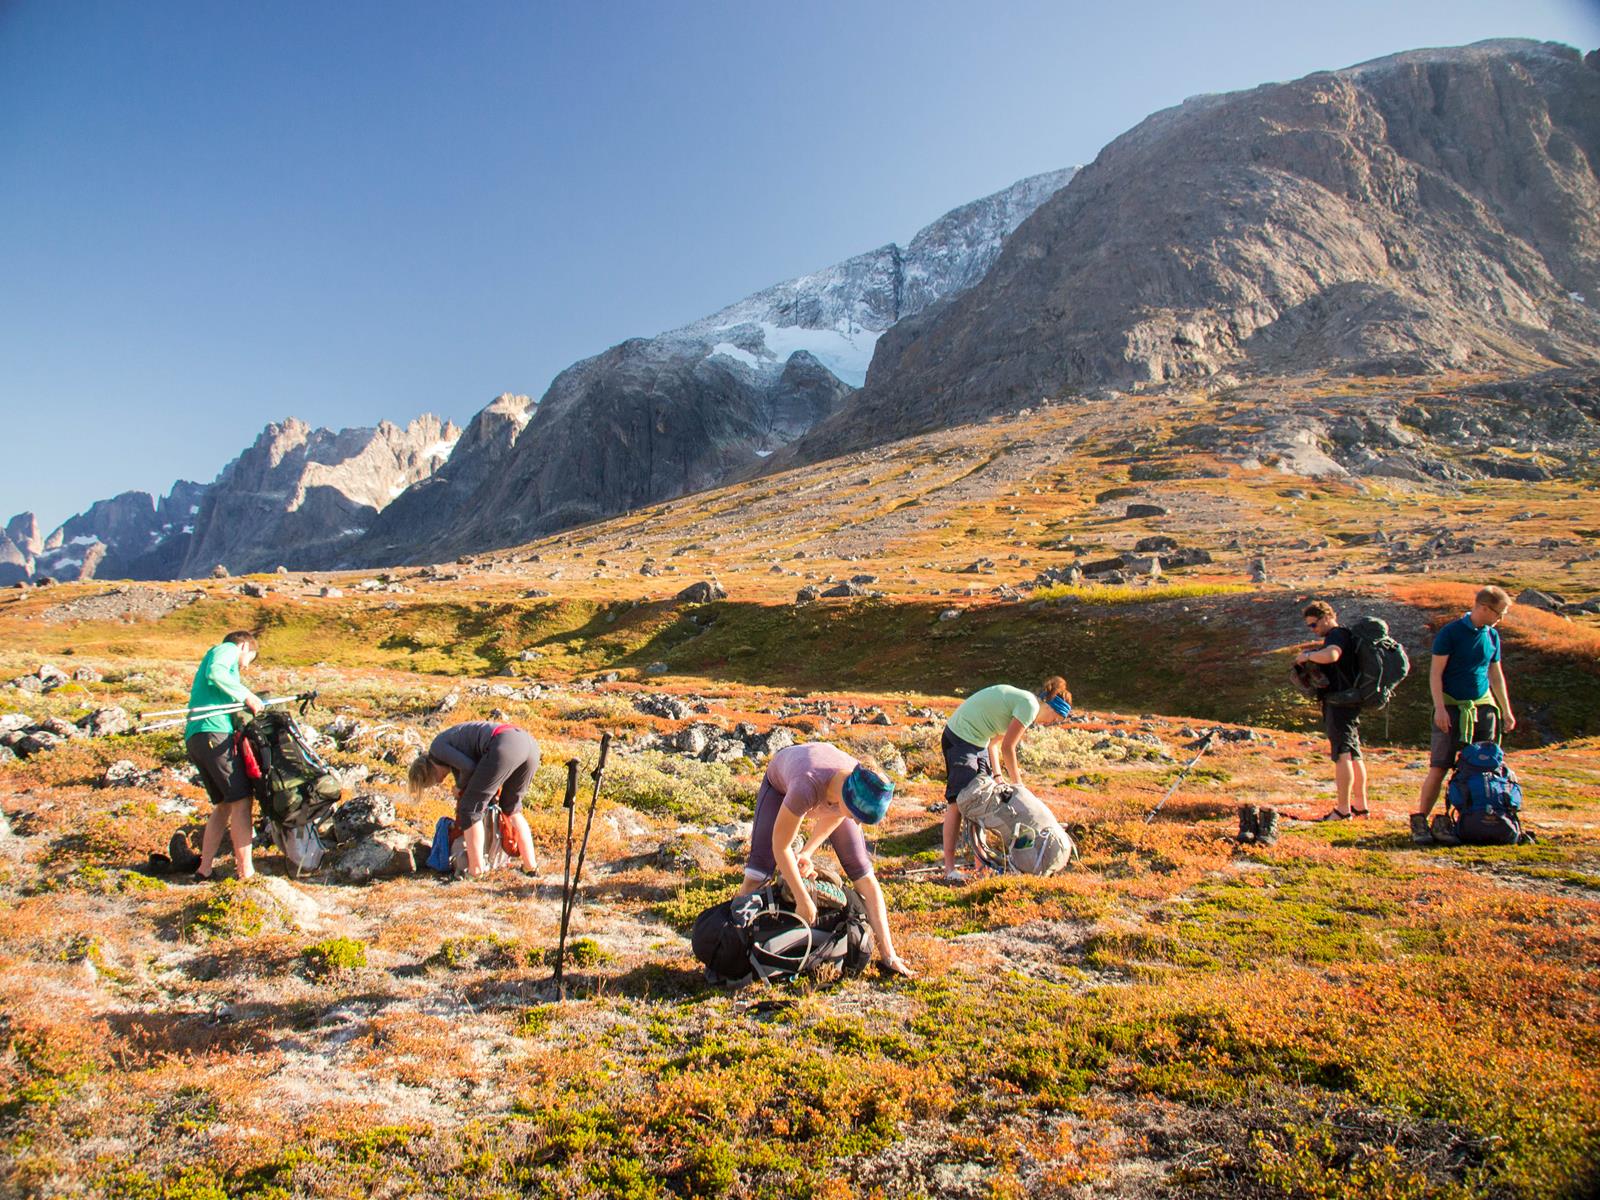
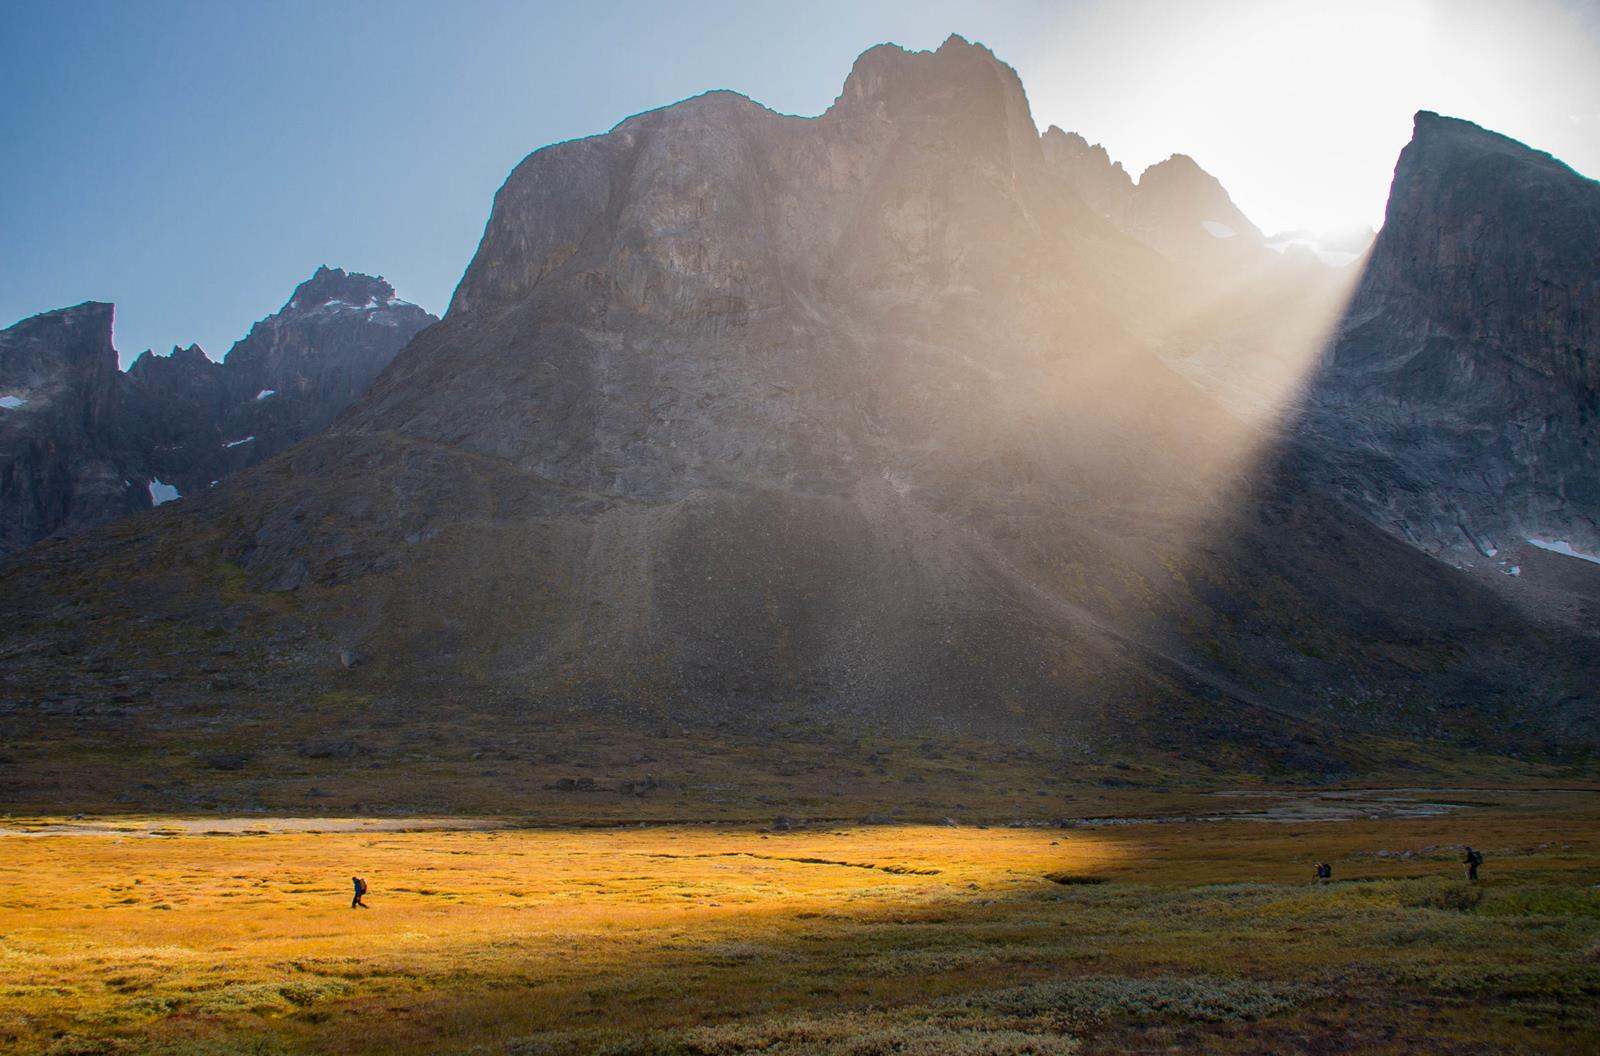
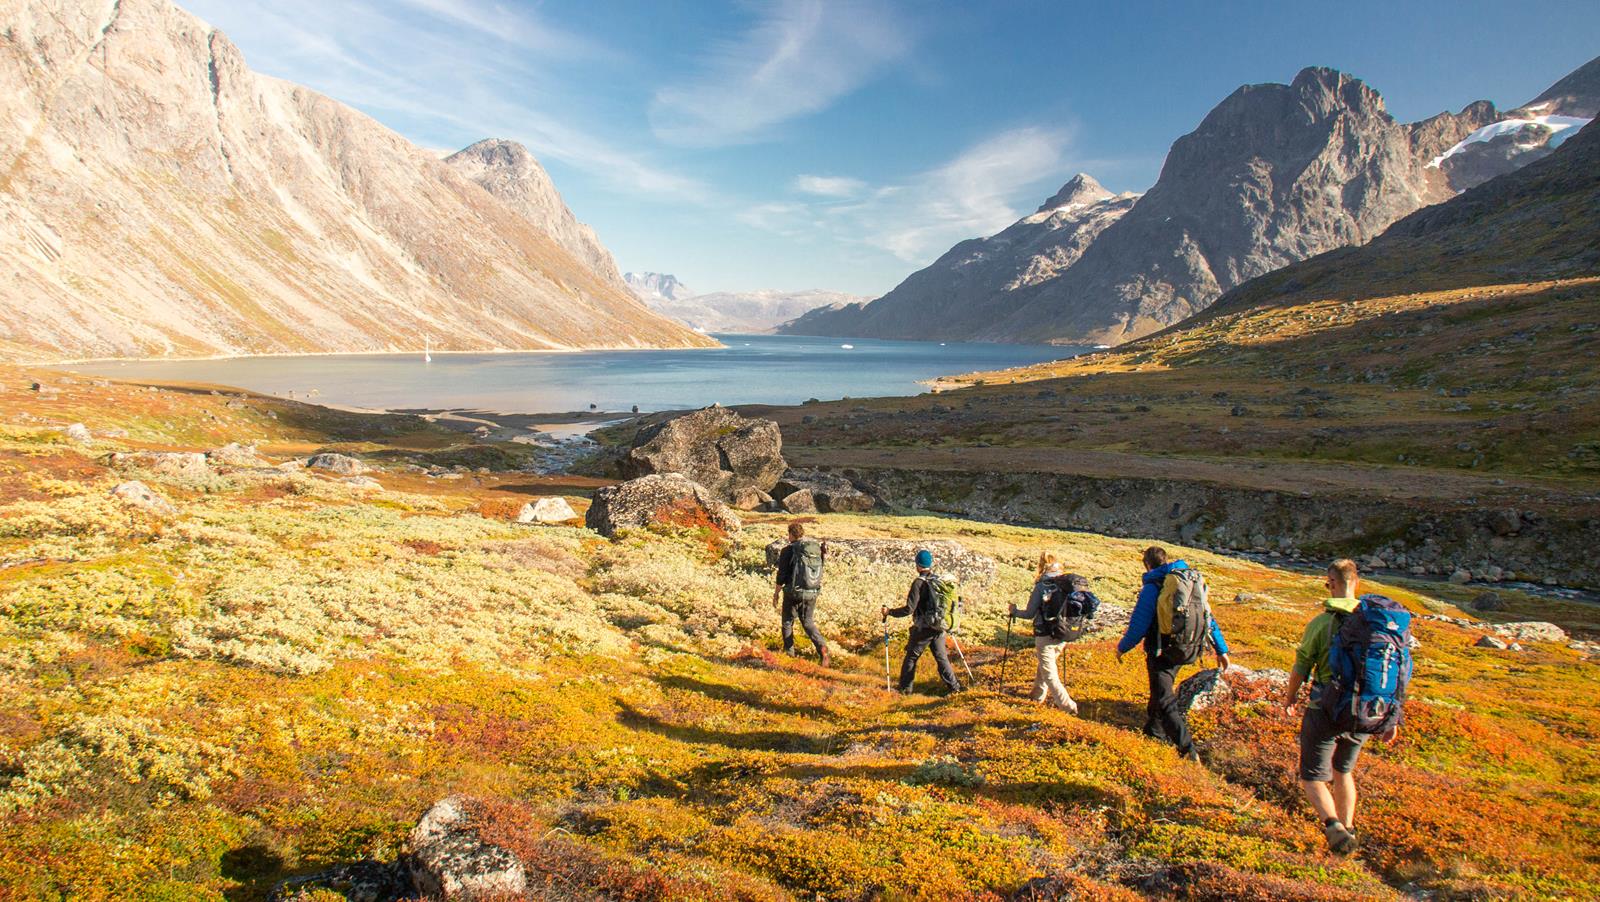
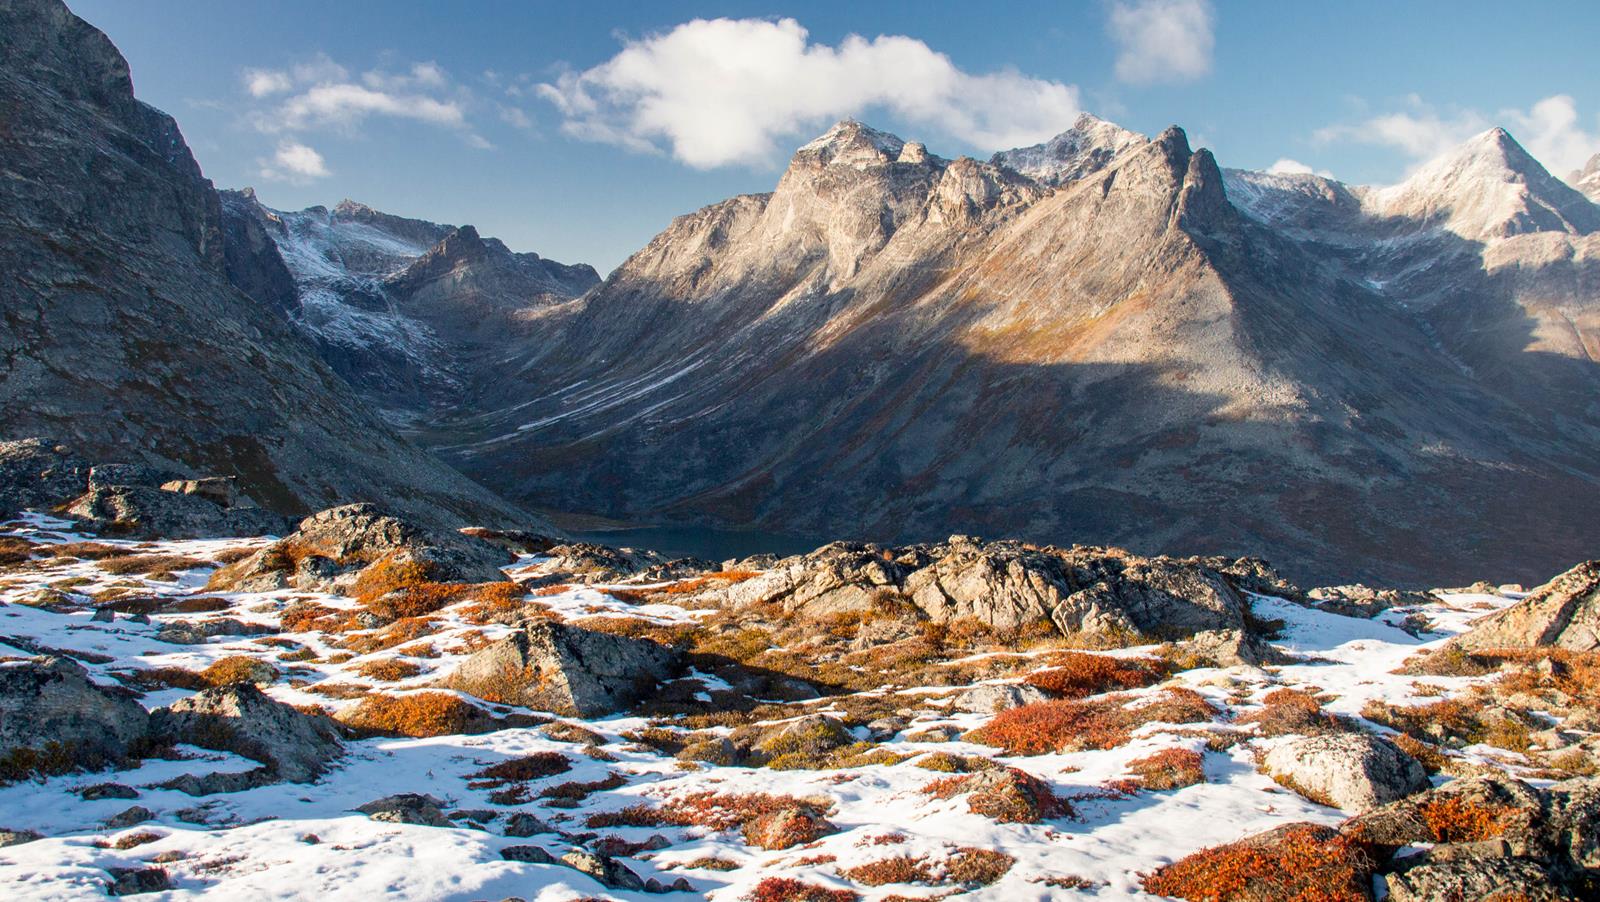
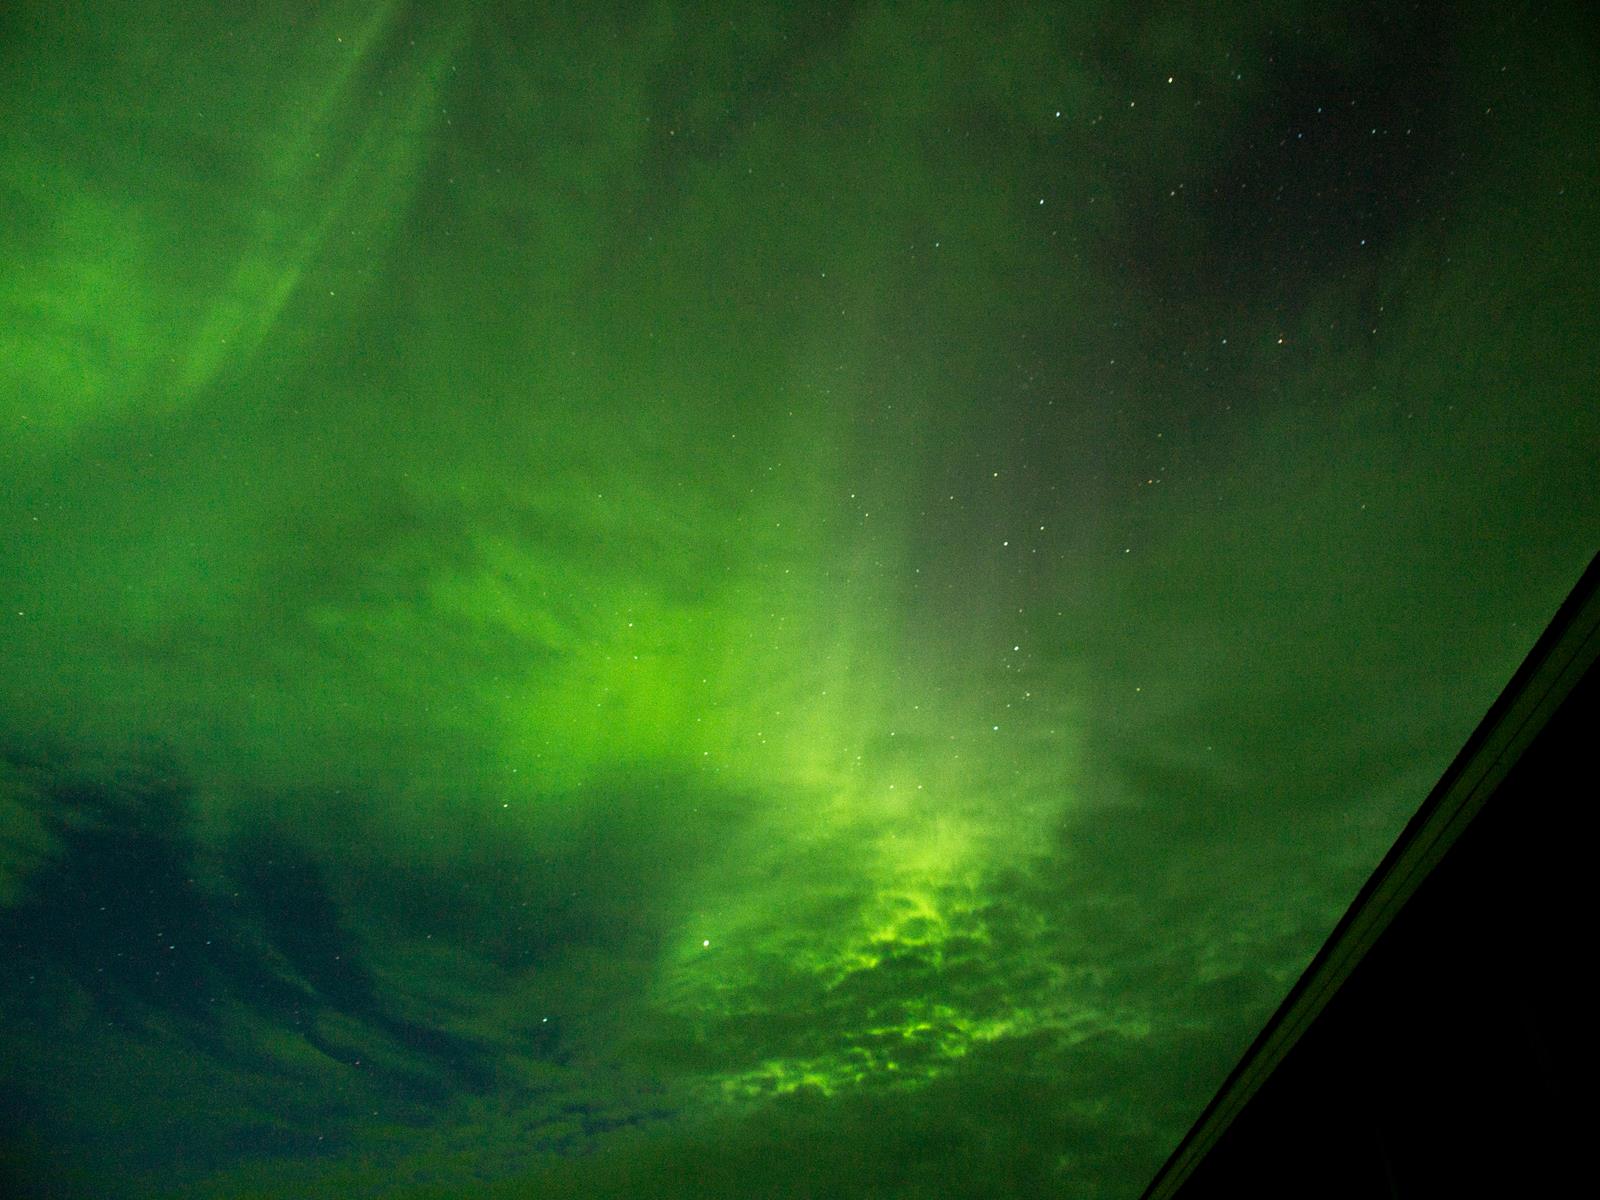
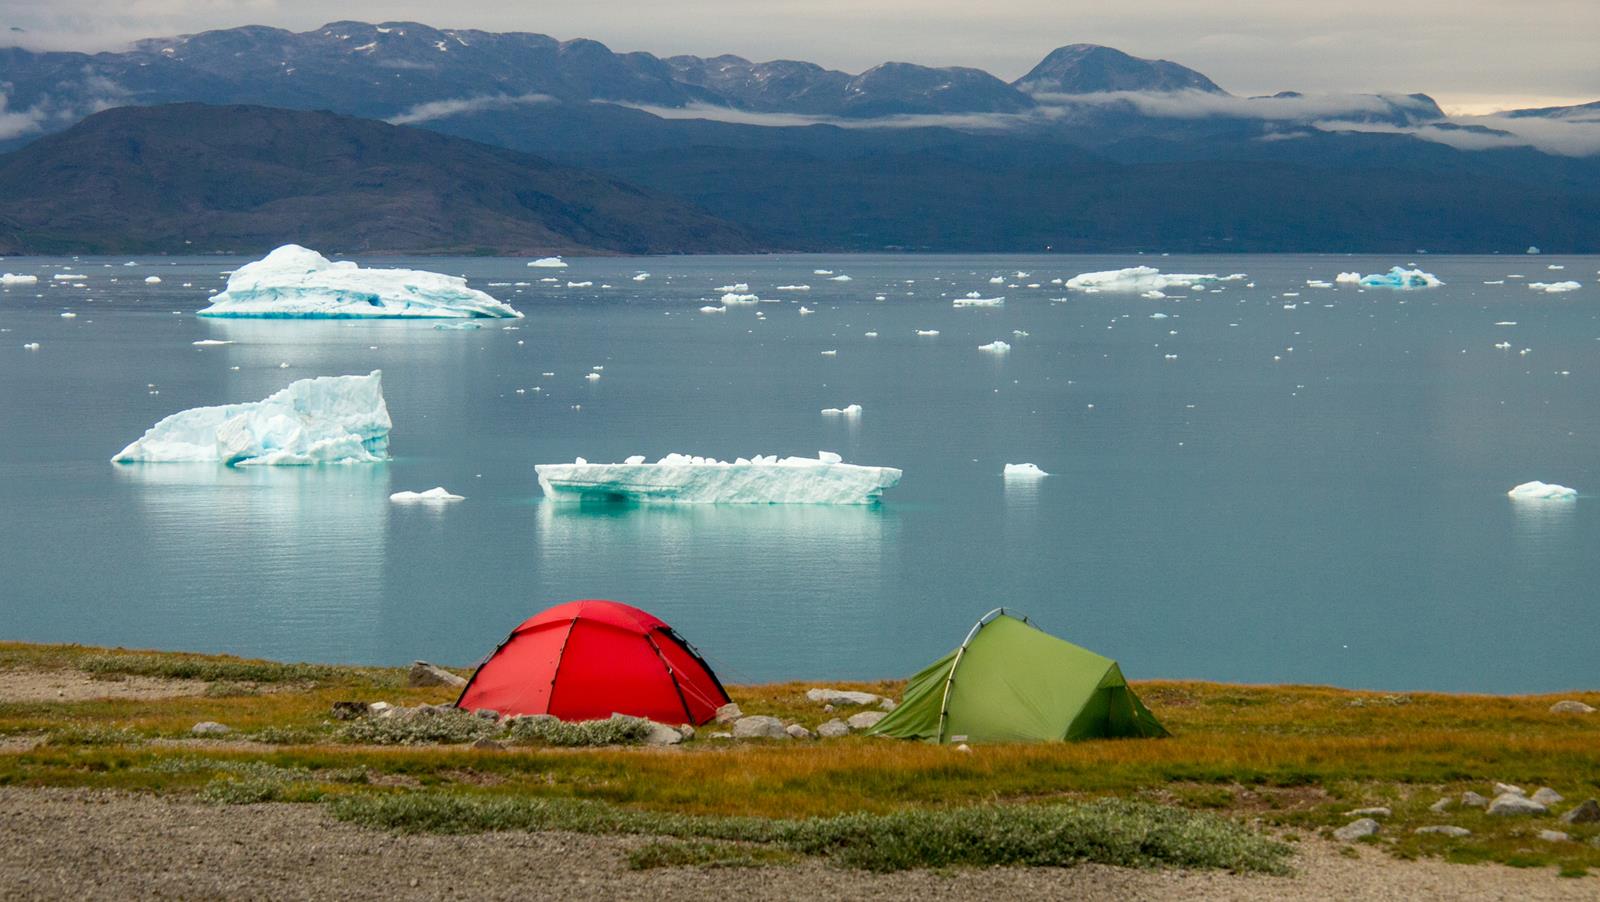
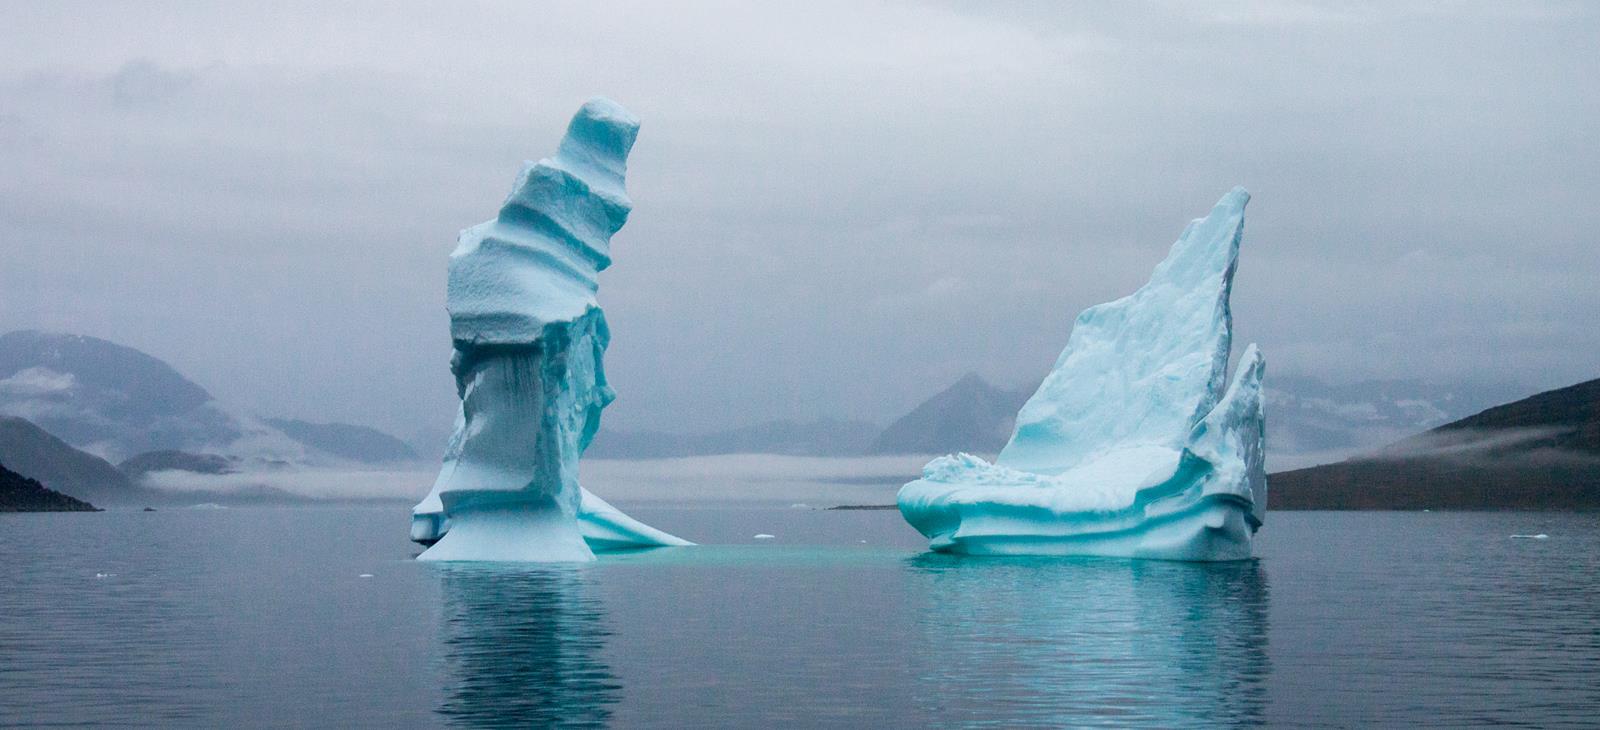
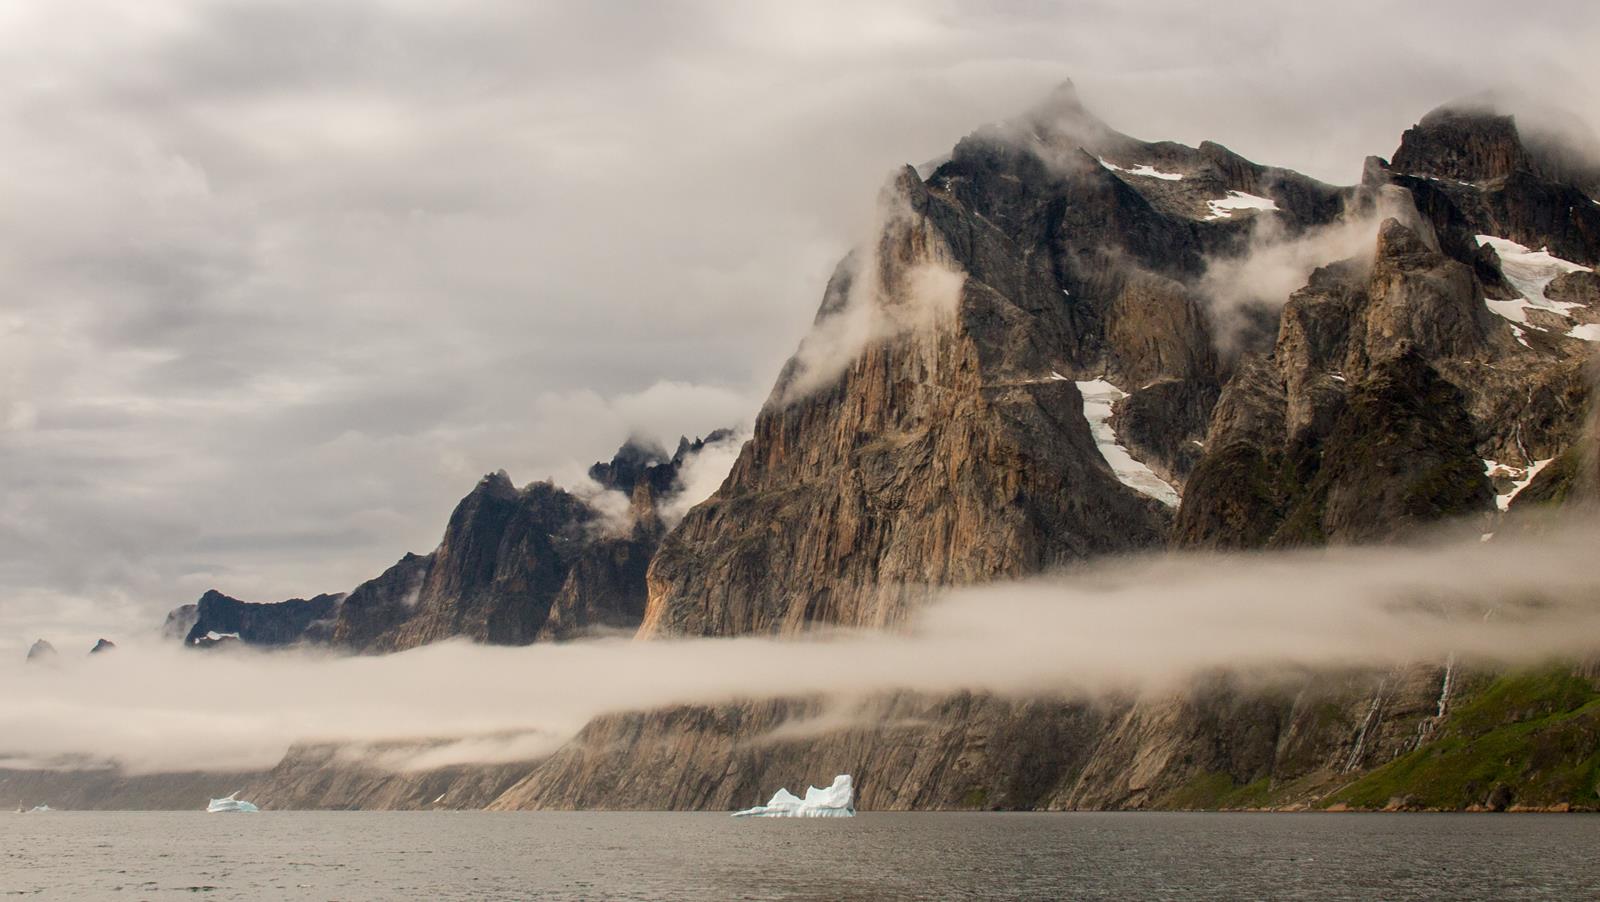
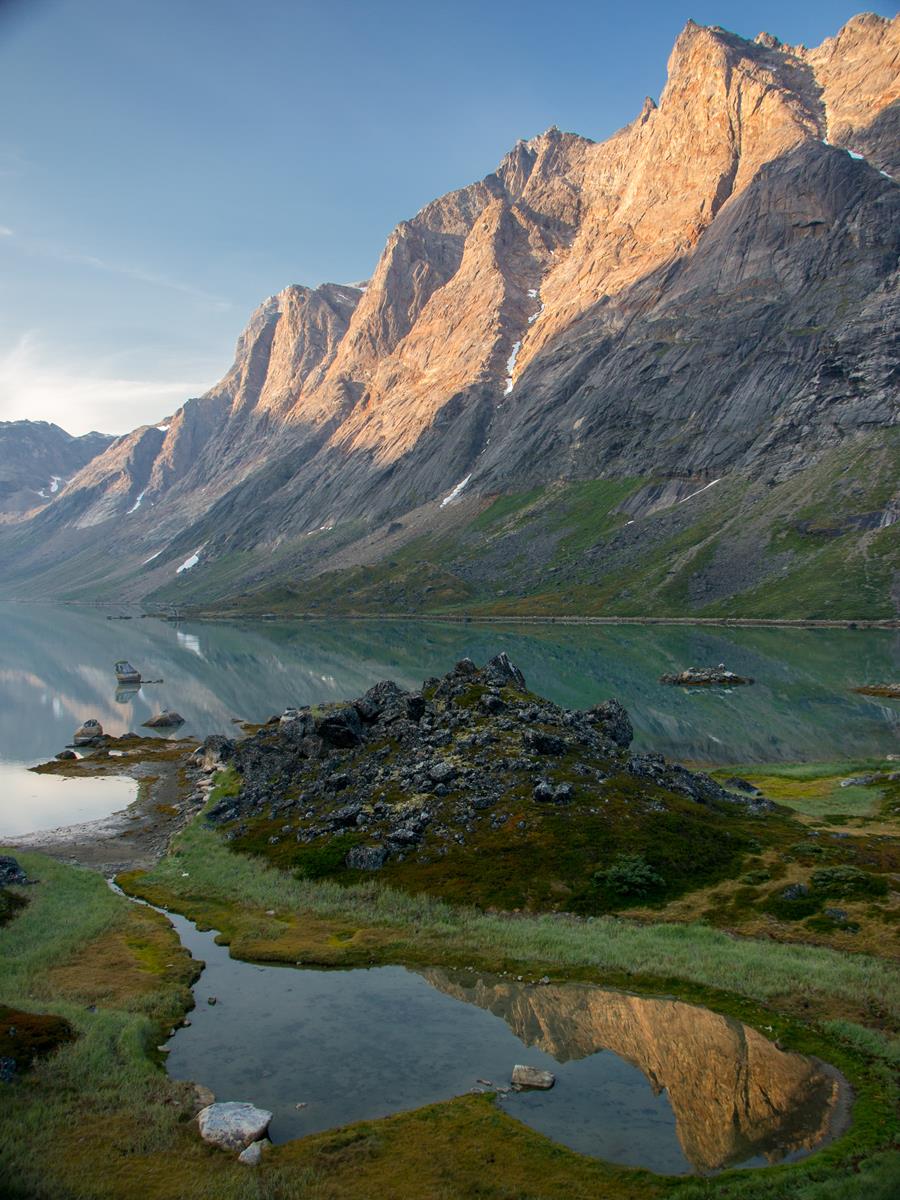
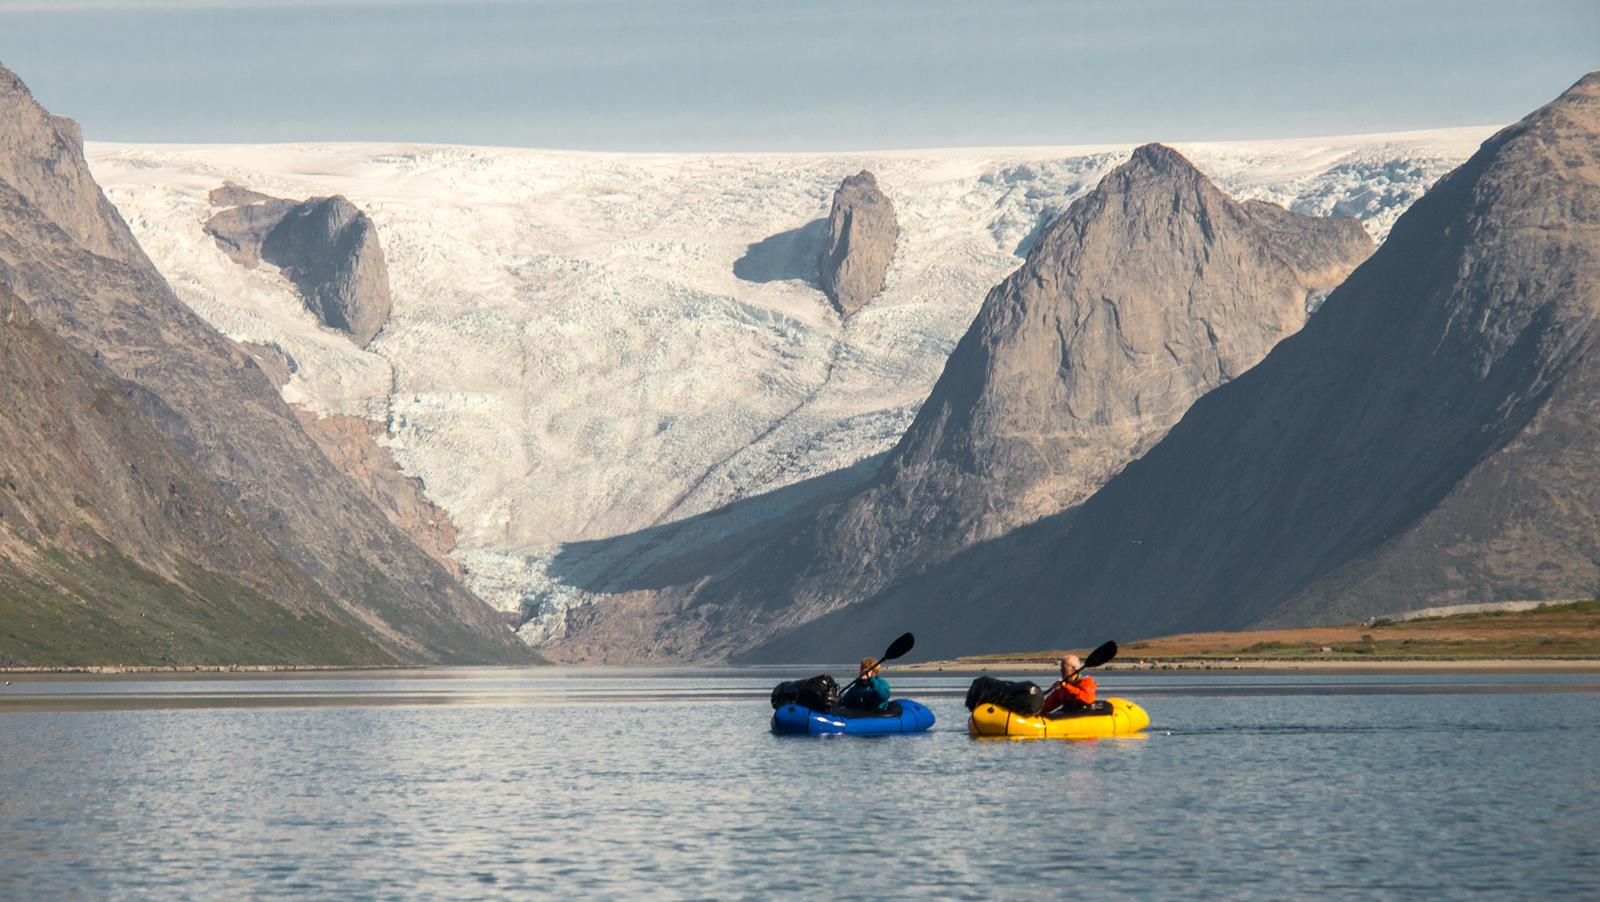
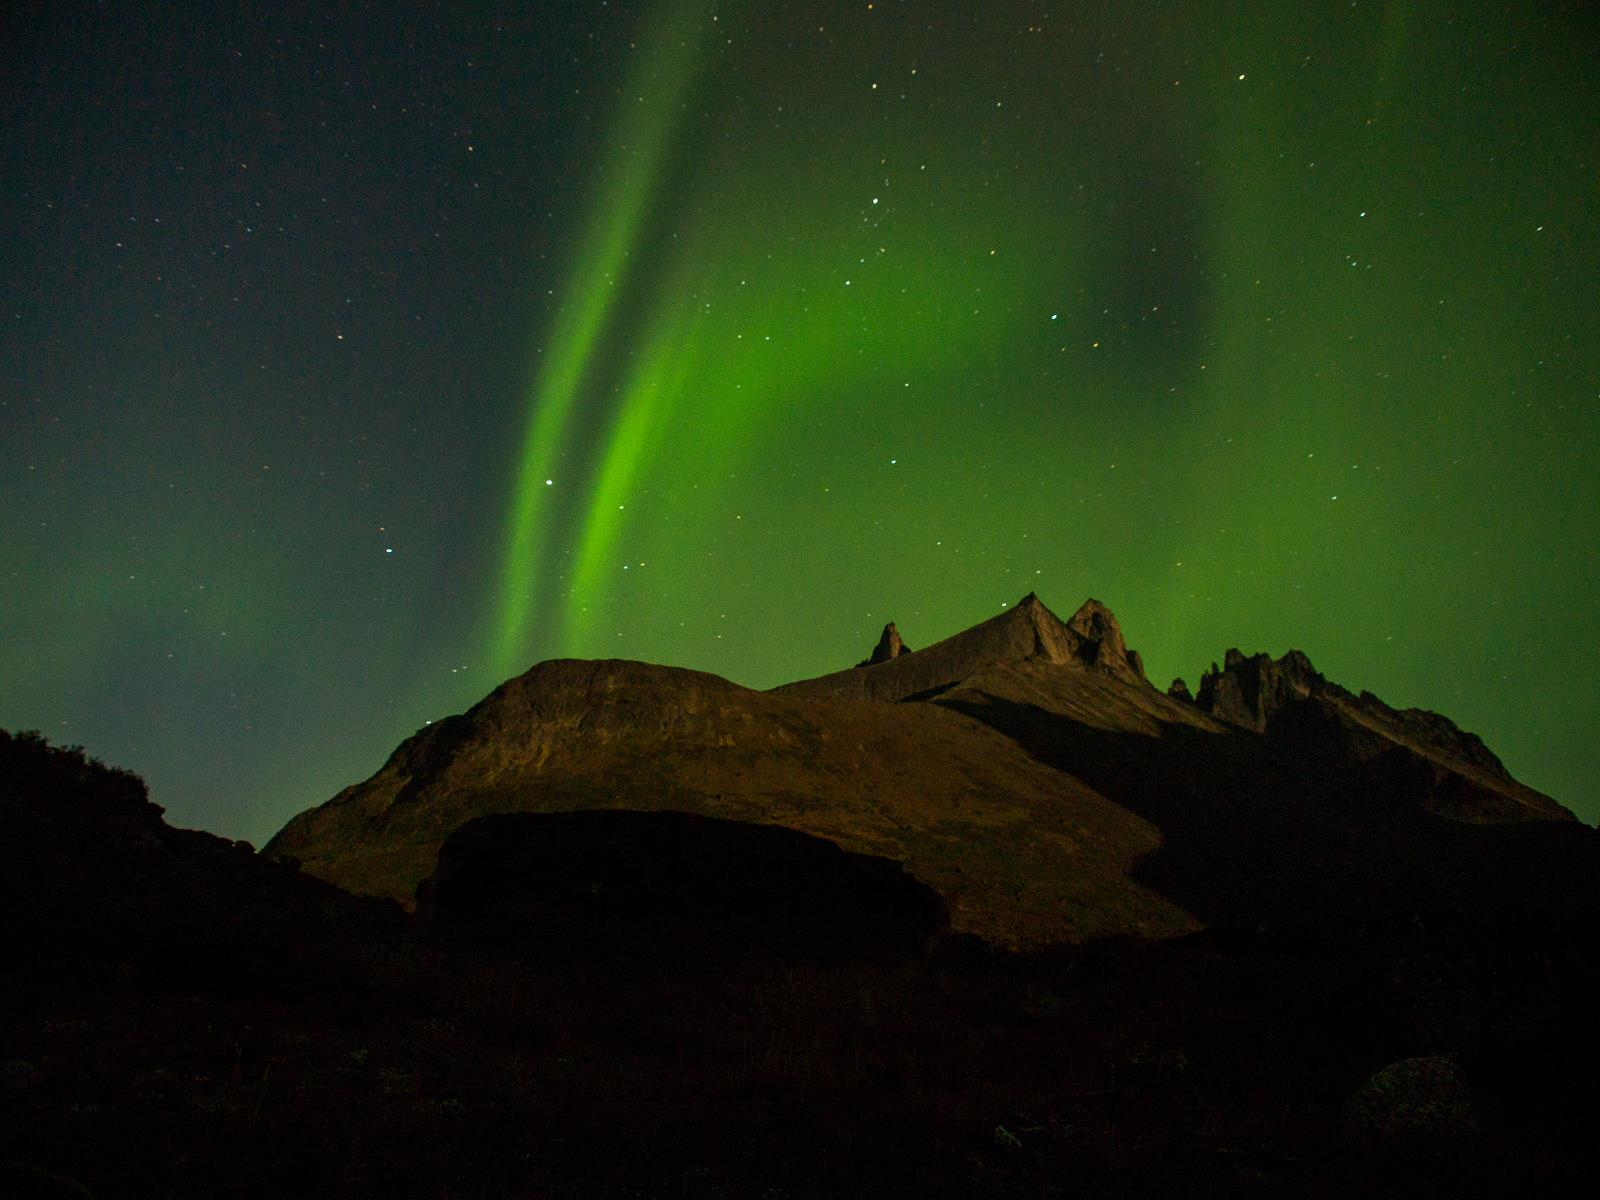
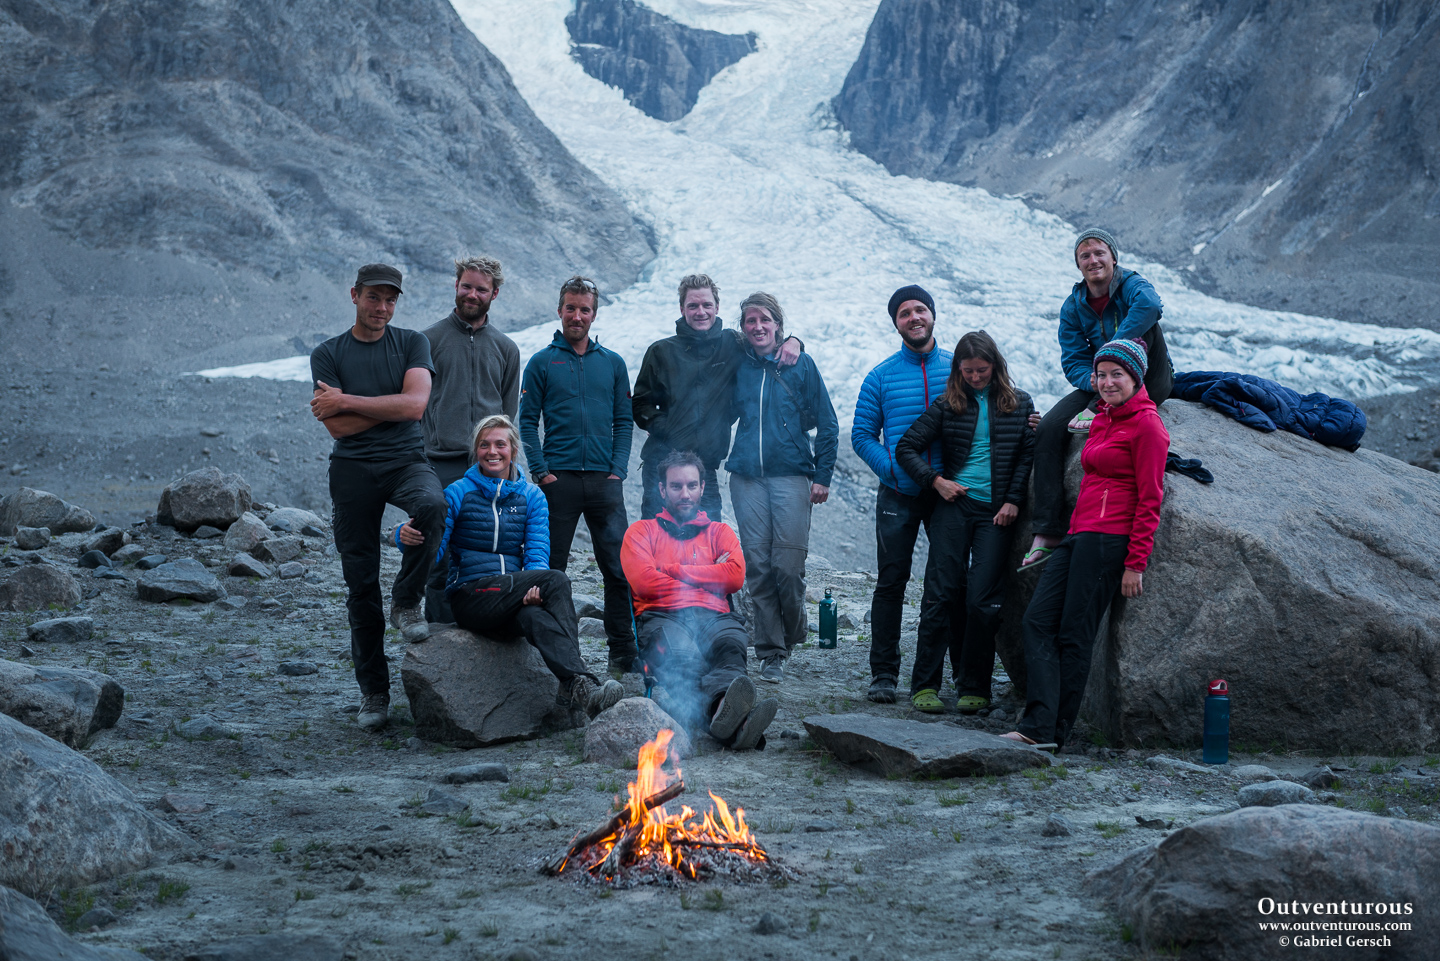
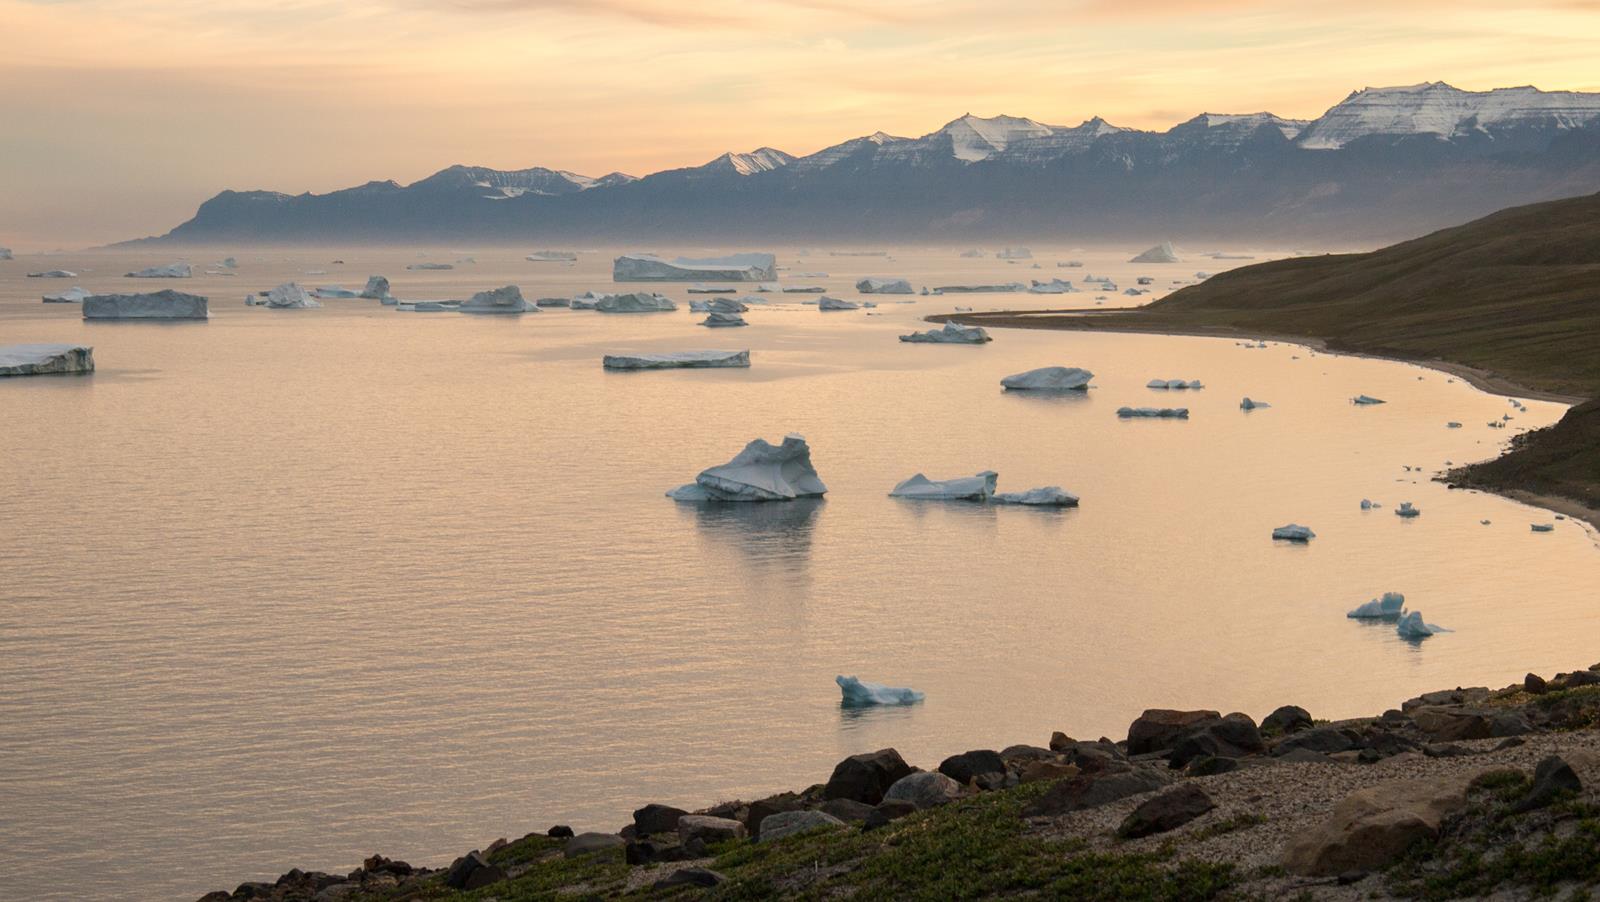
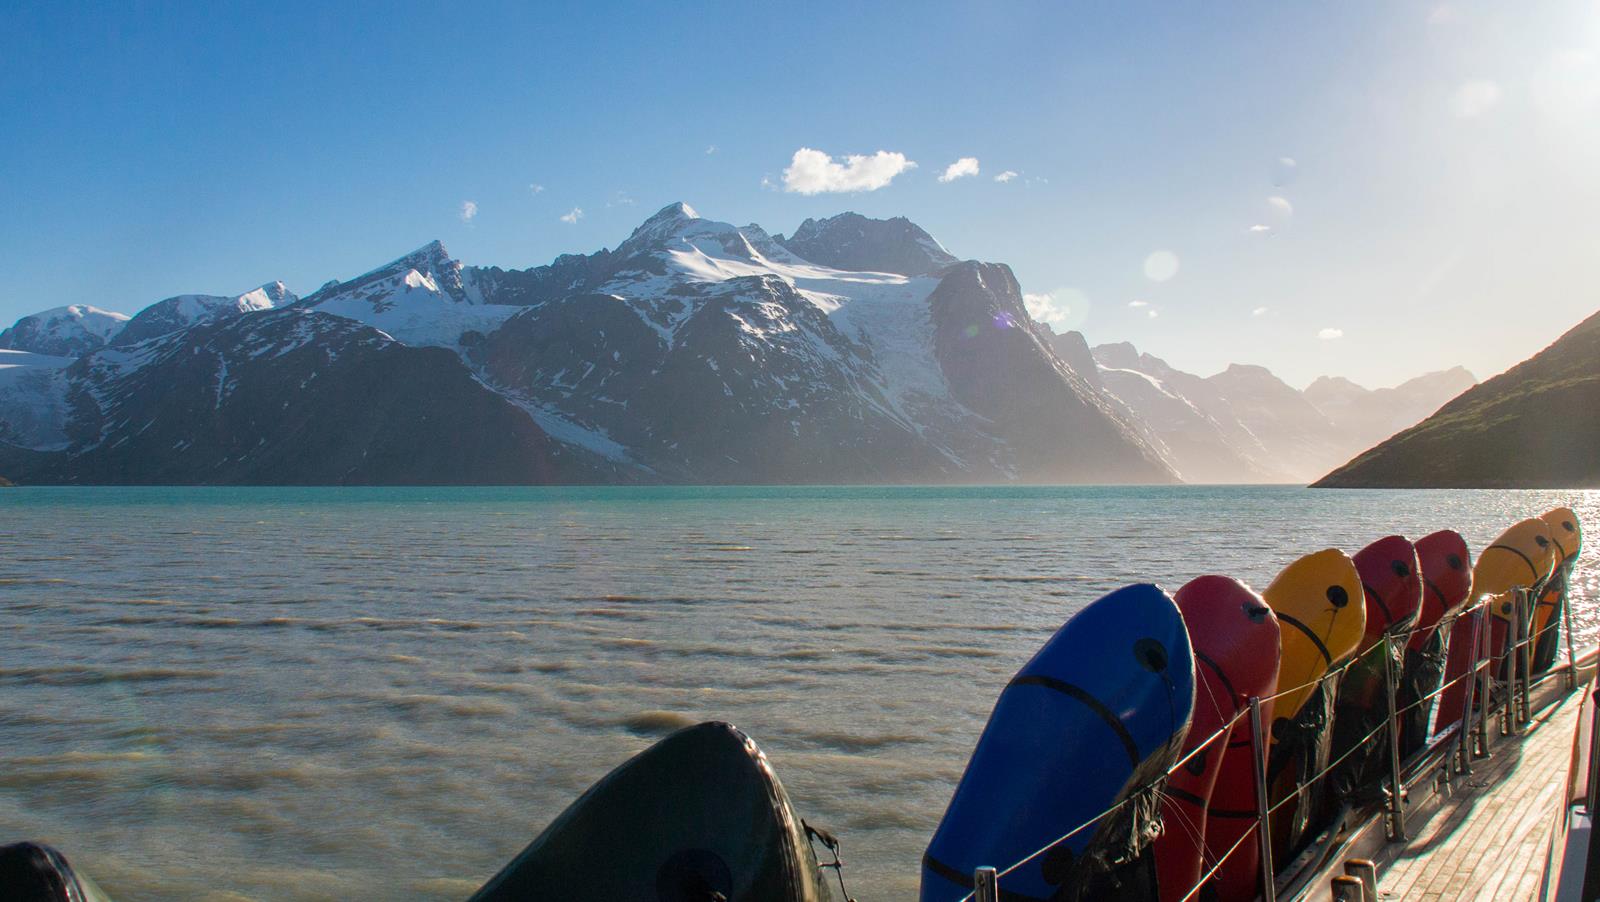
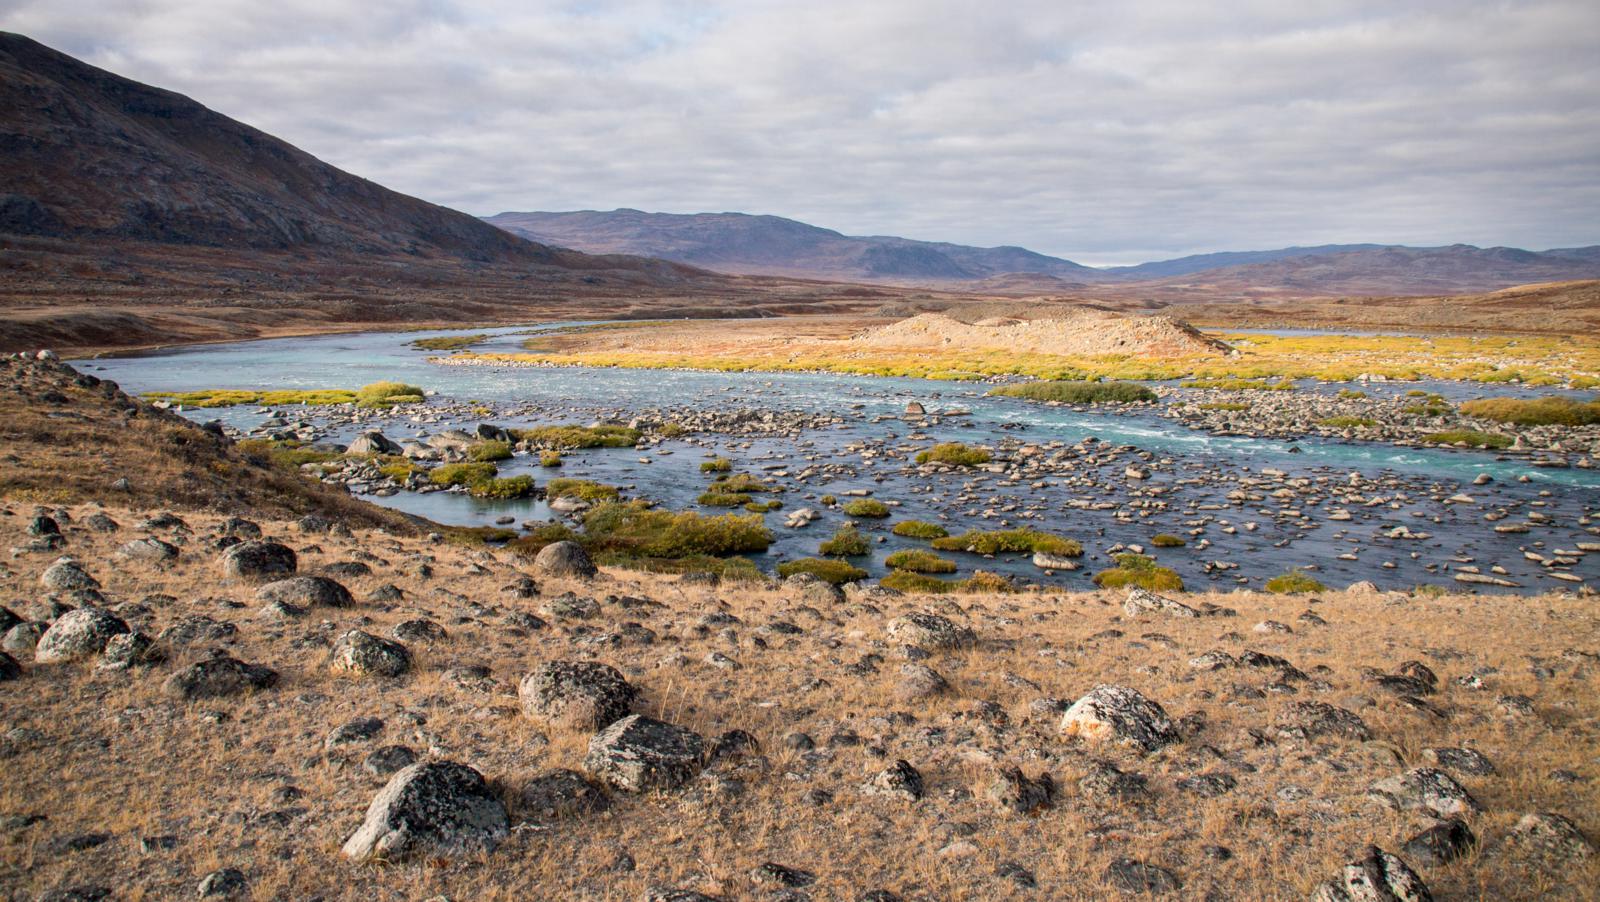
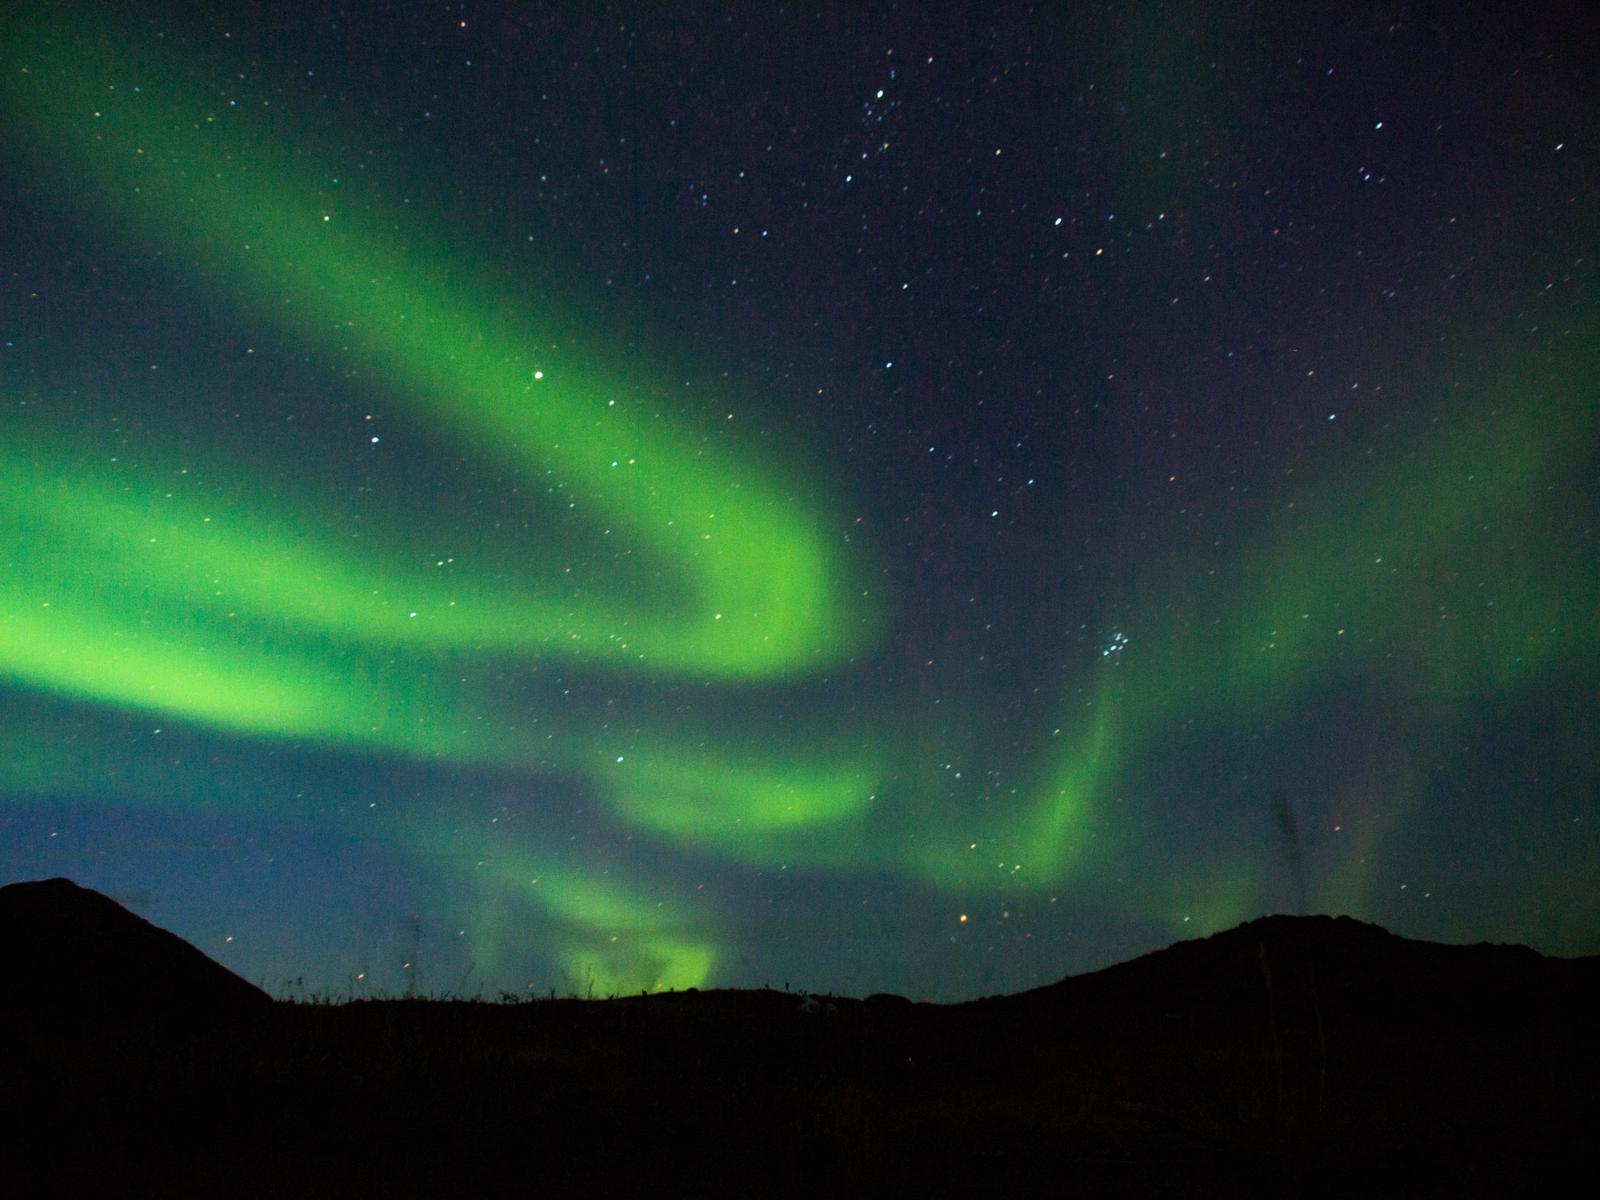
After the group from our last land expedition flew out again, I hopped back on board the sailing yacht, which had in the meantime navigated towards the Southern Fringes of Greenland. September was a magnificent final to a long summer: golden autumn colours, fresh snow, multiple active aurora shows, and some of Greenland’s finest scenery in the coastal labyrith of fjords, mountains and sea straits near Cape Farewell. Enjoy!
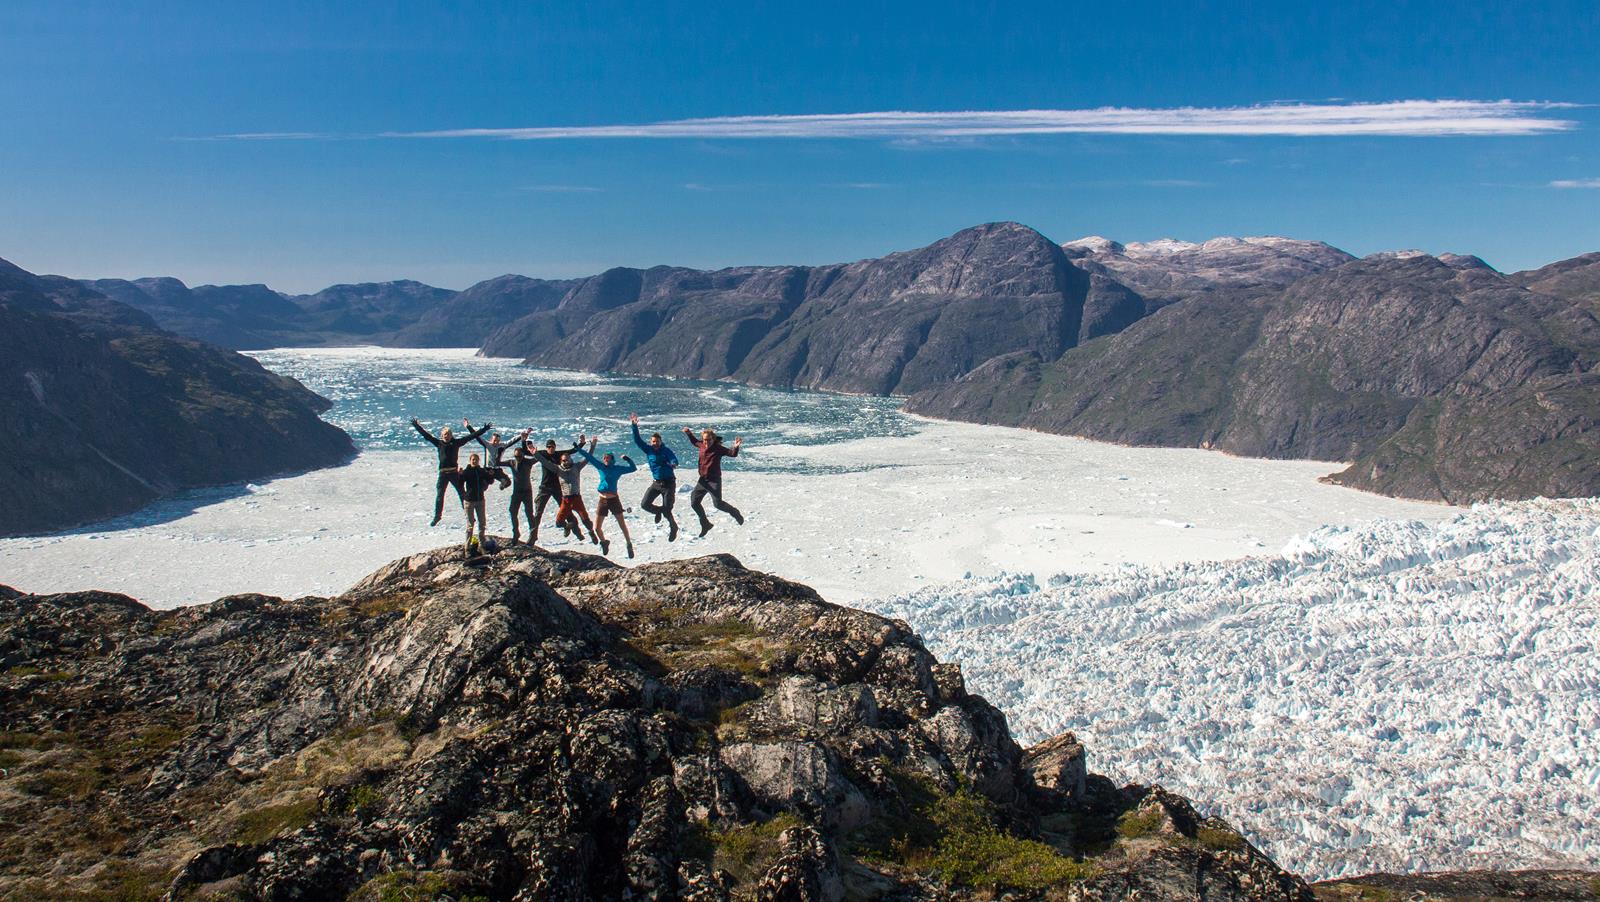
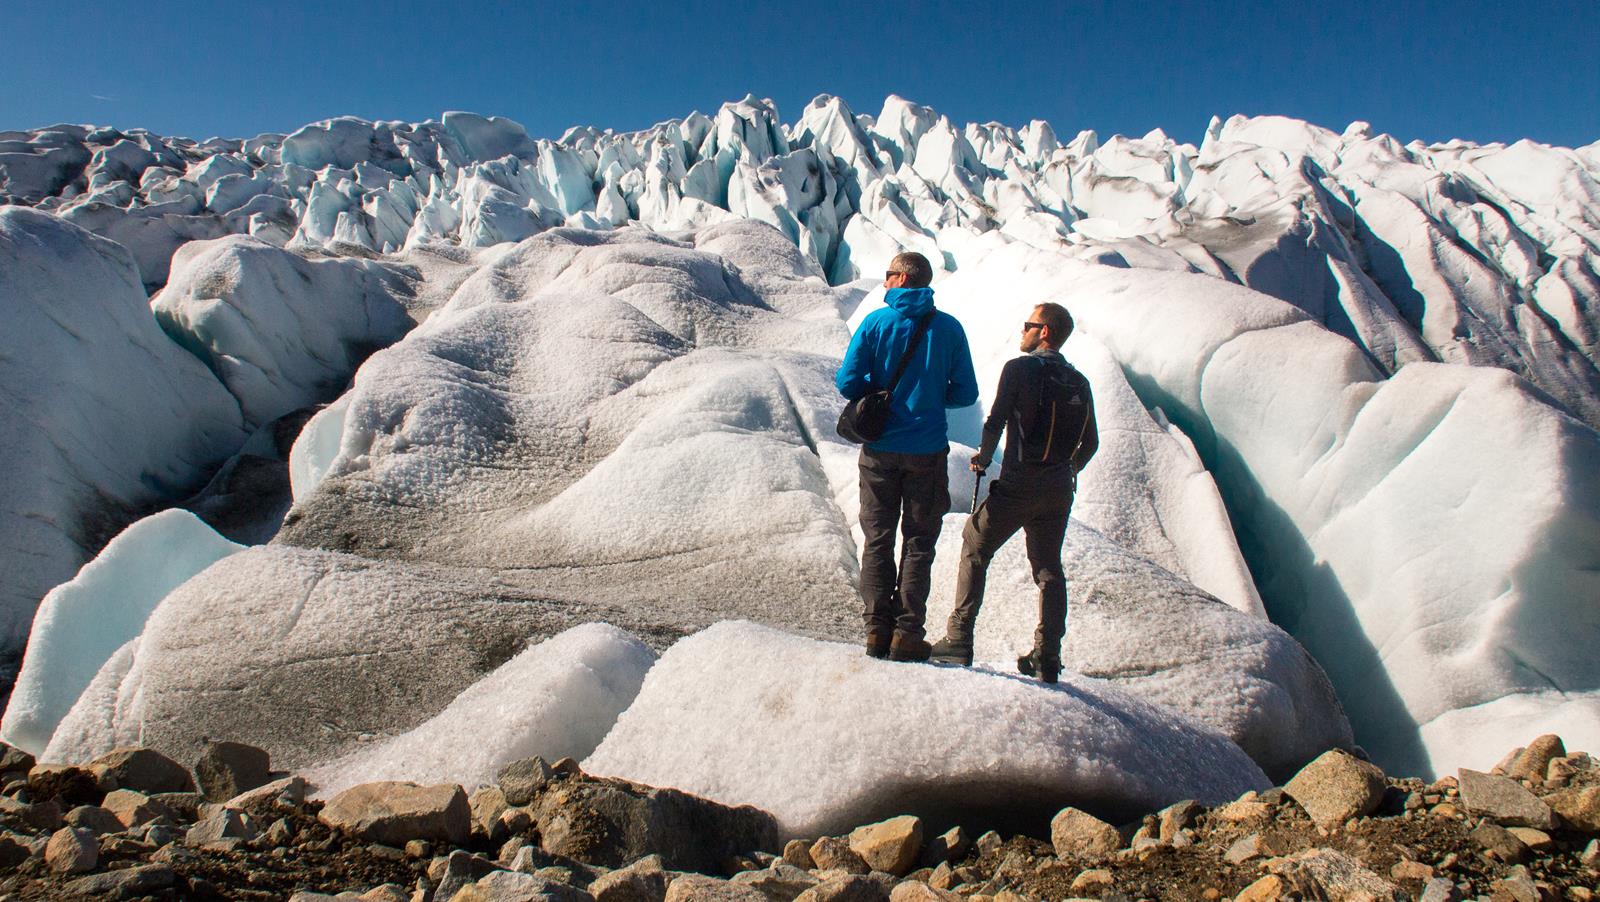
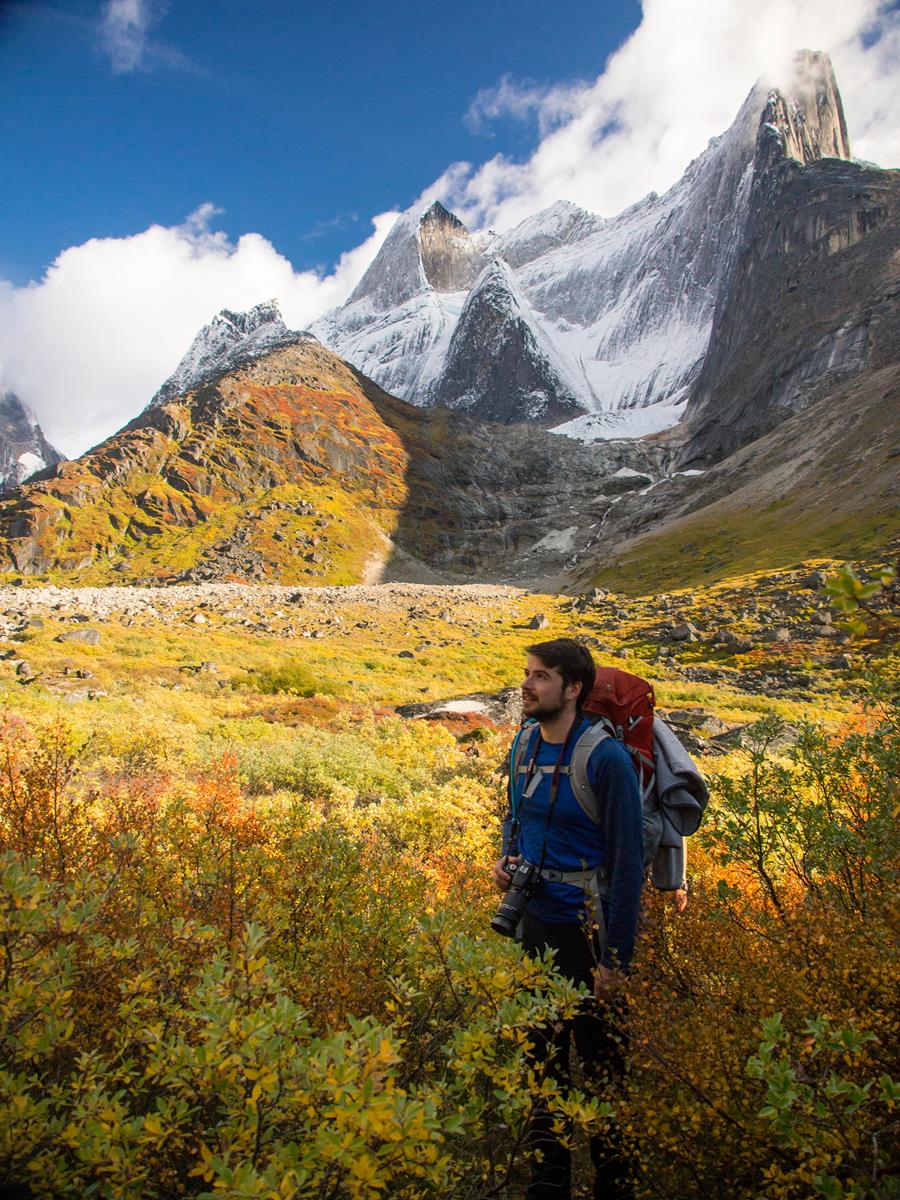
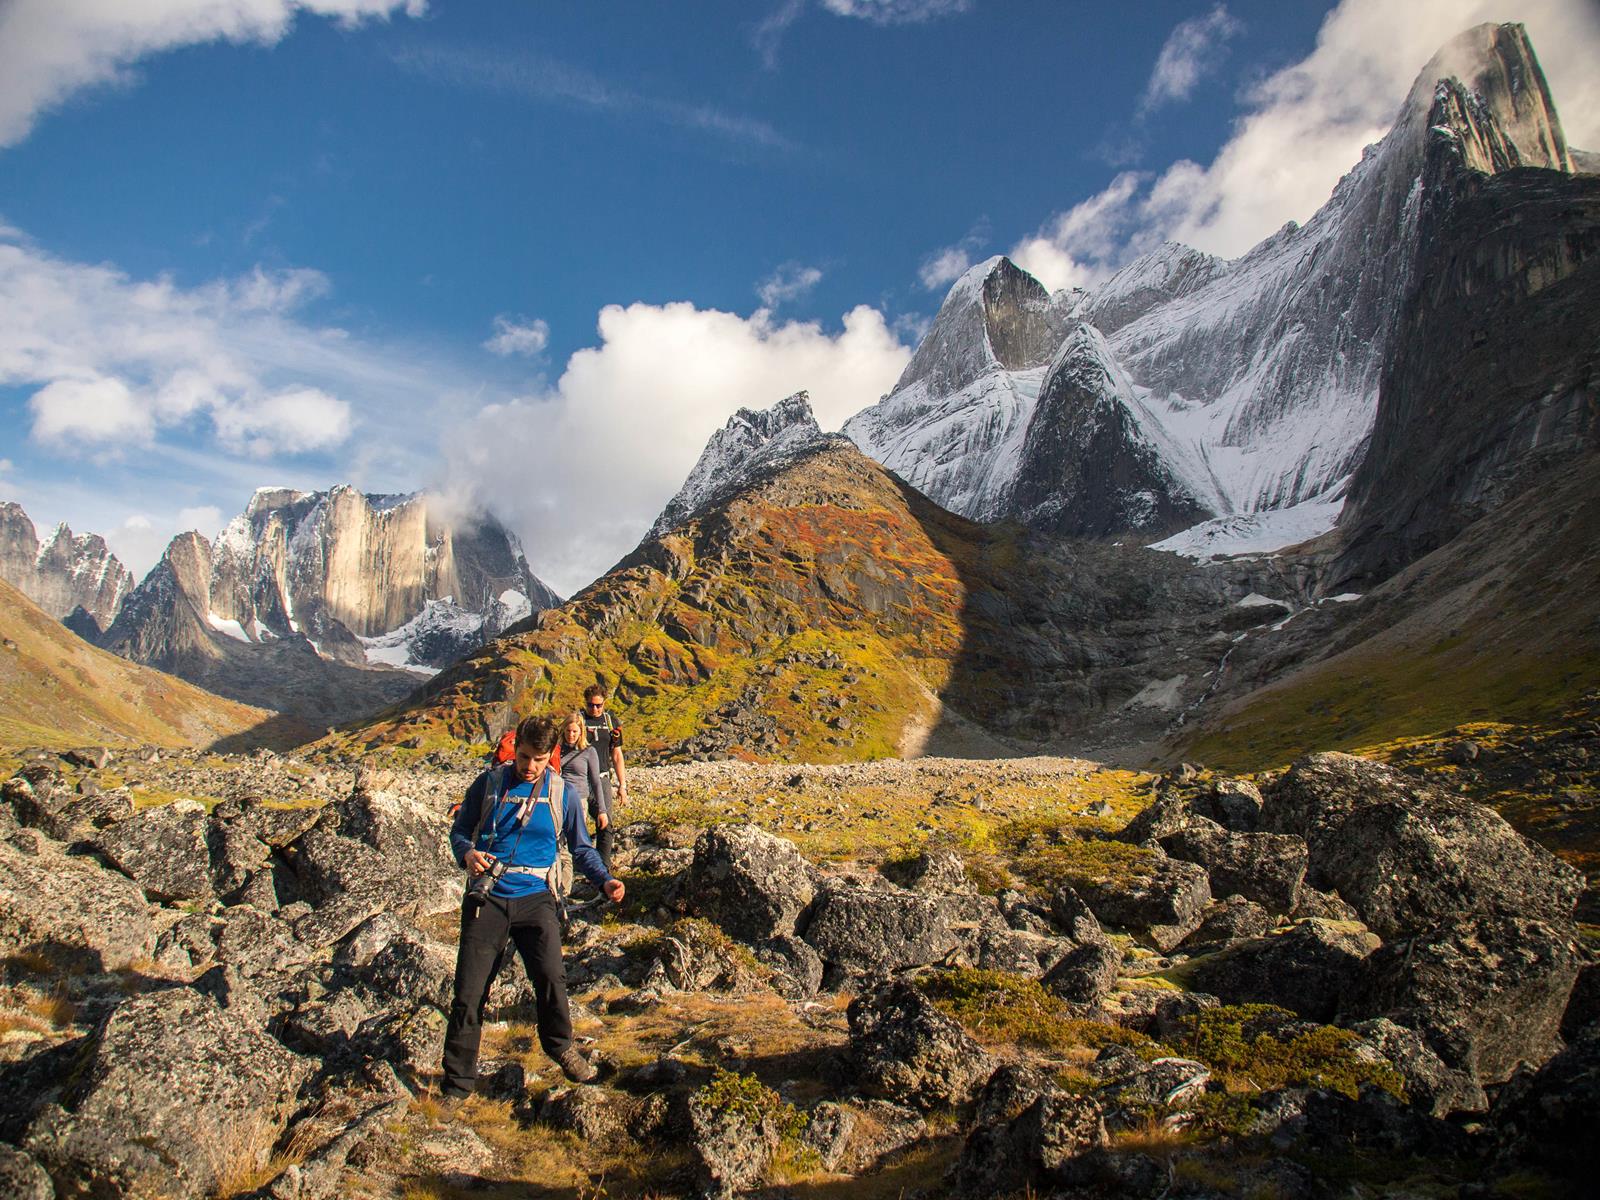
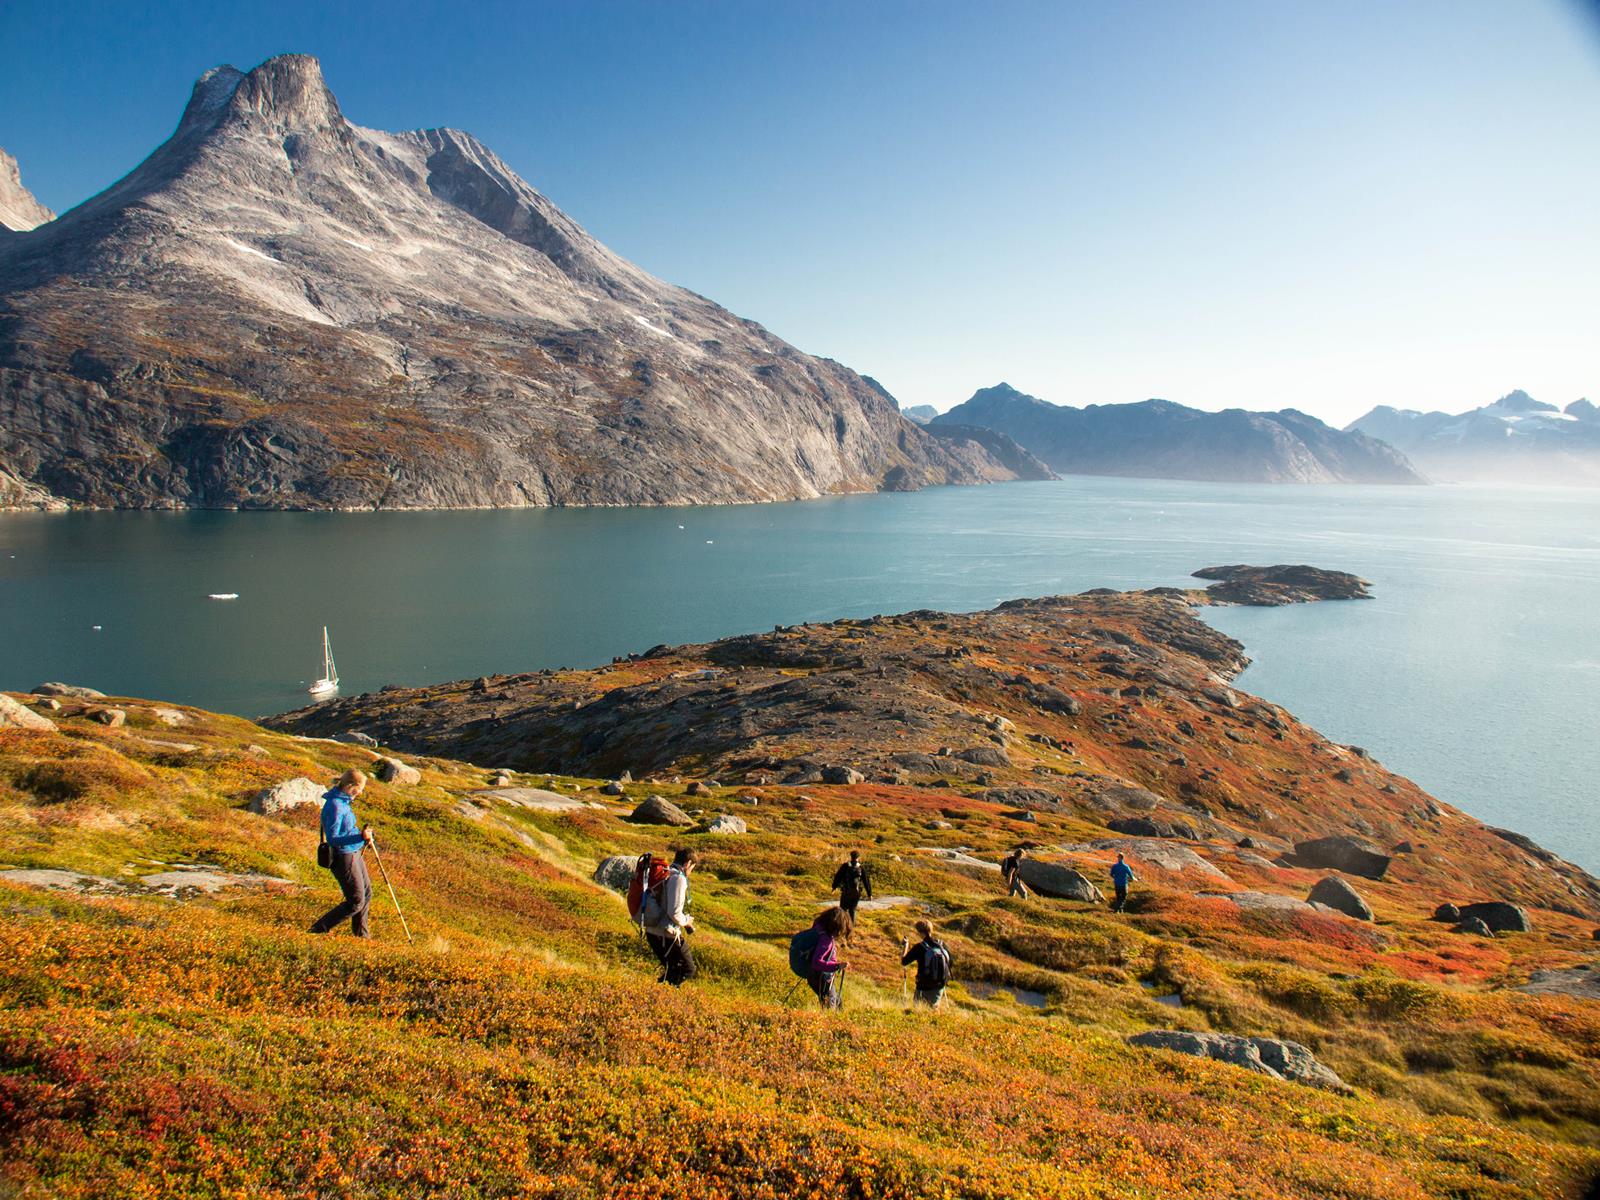
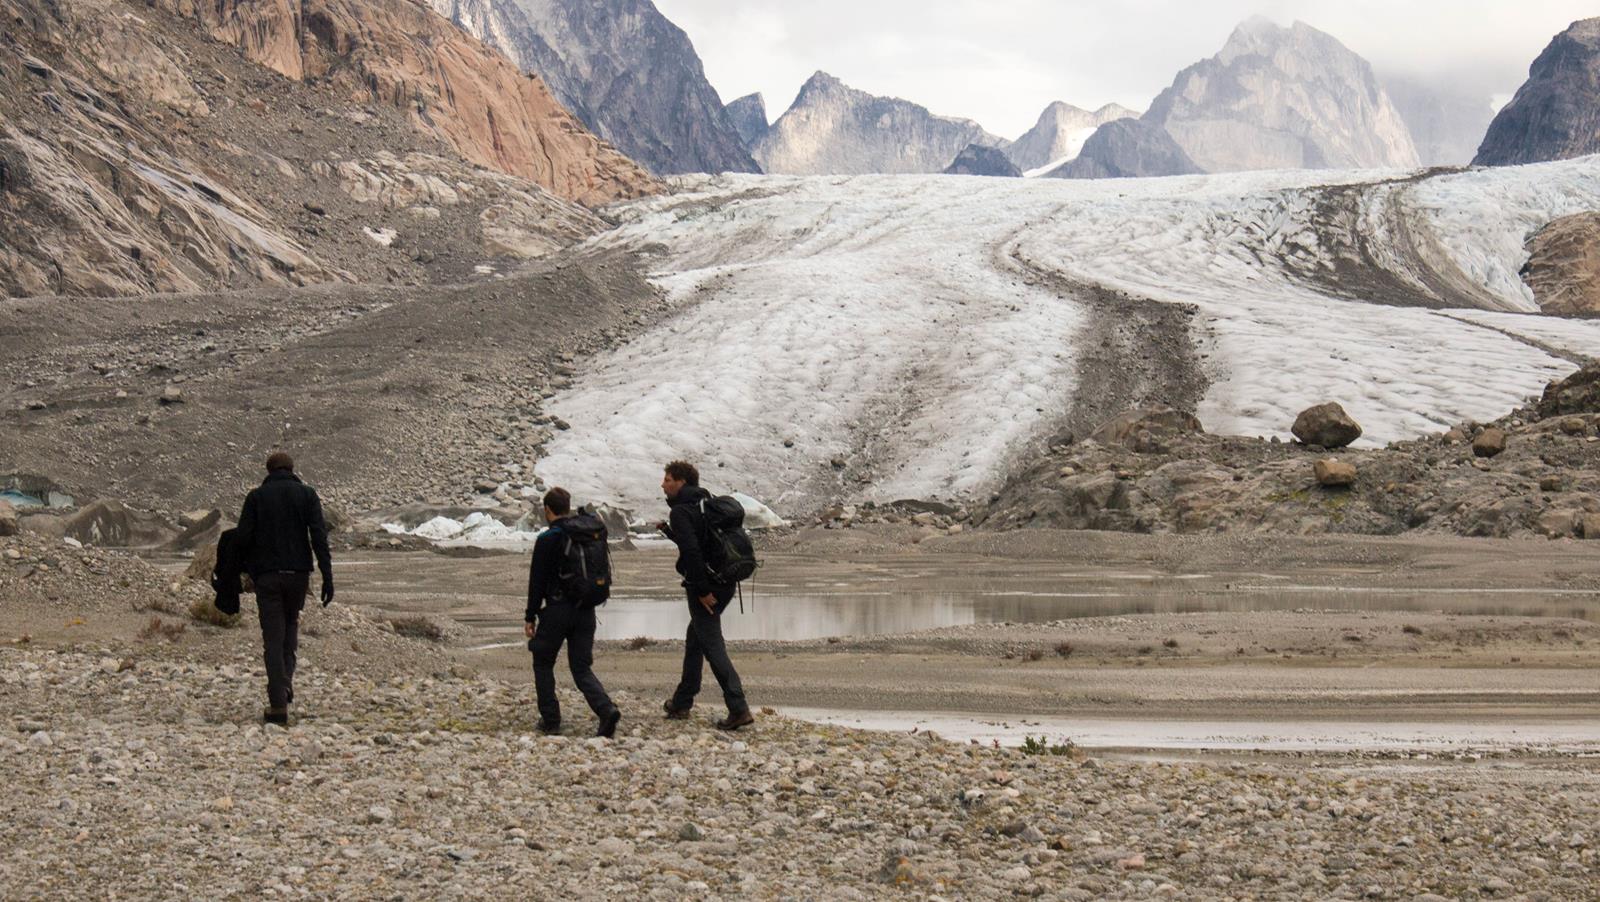
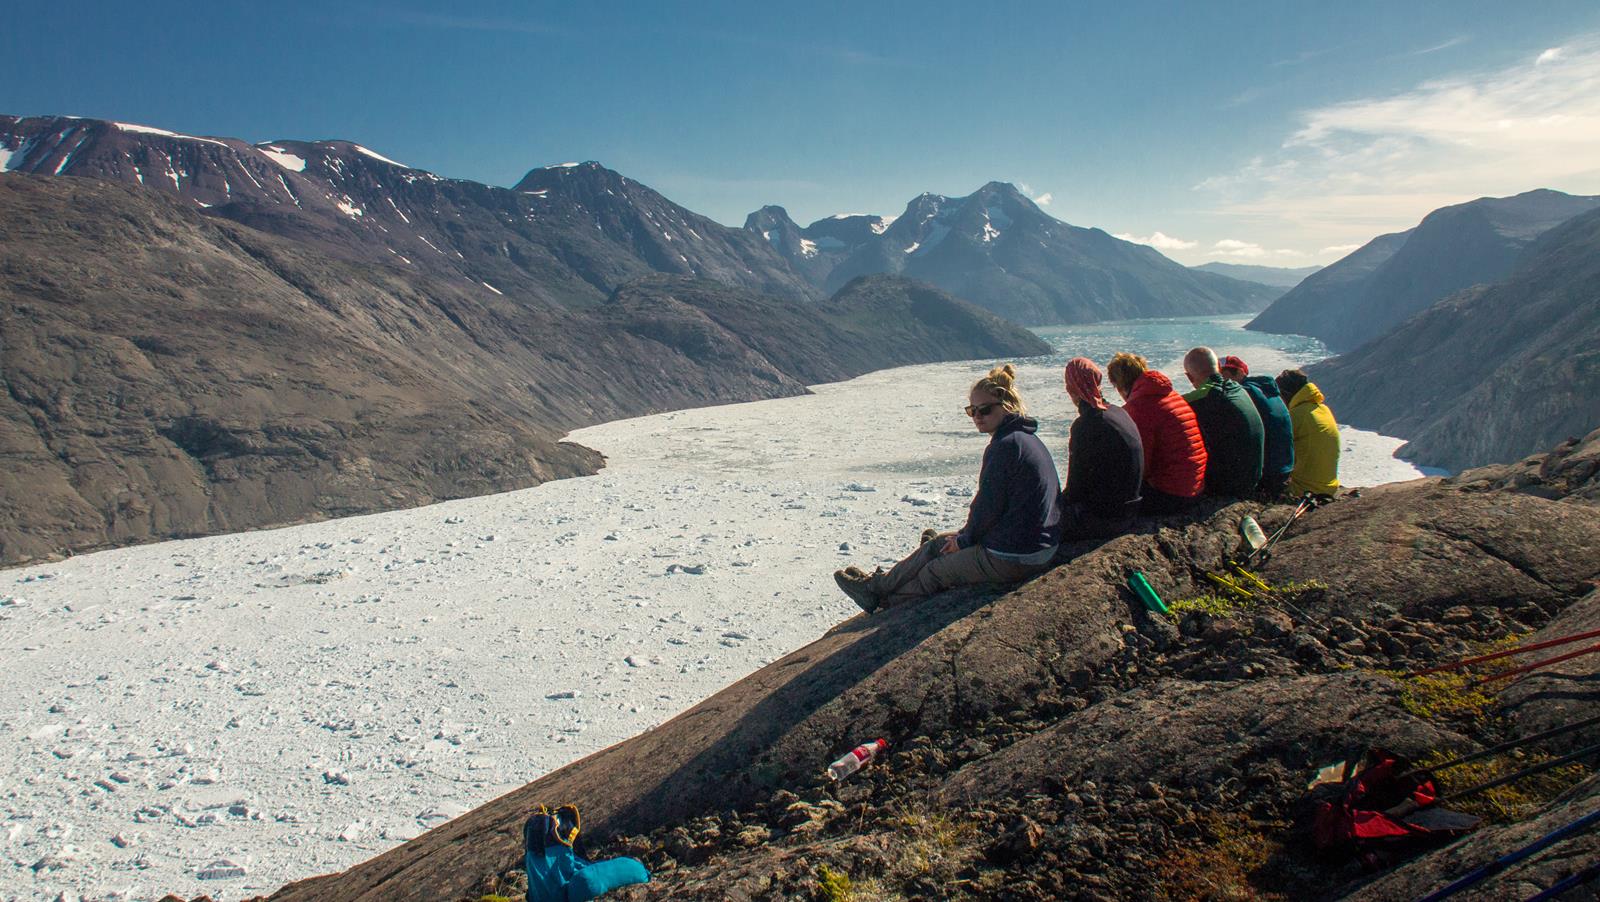
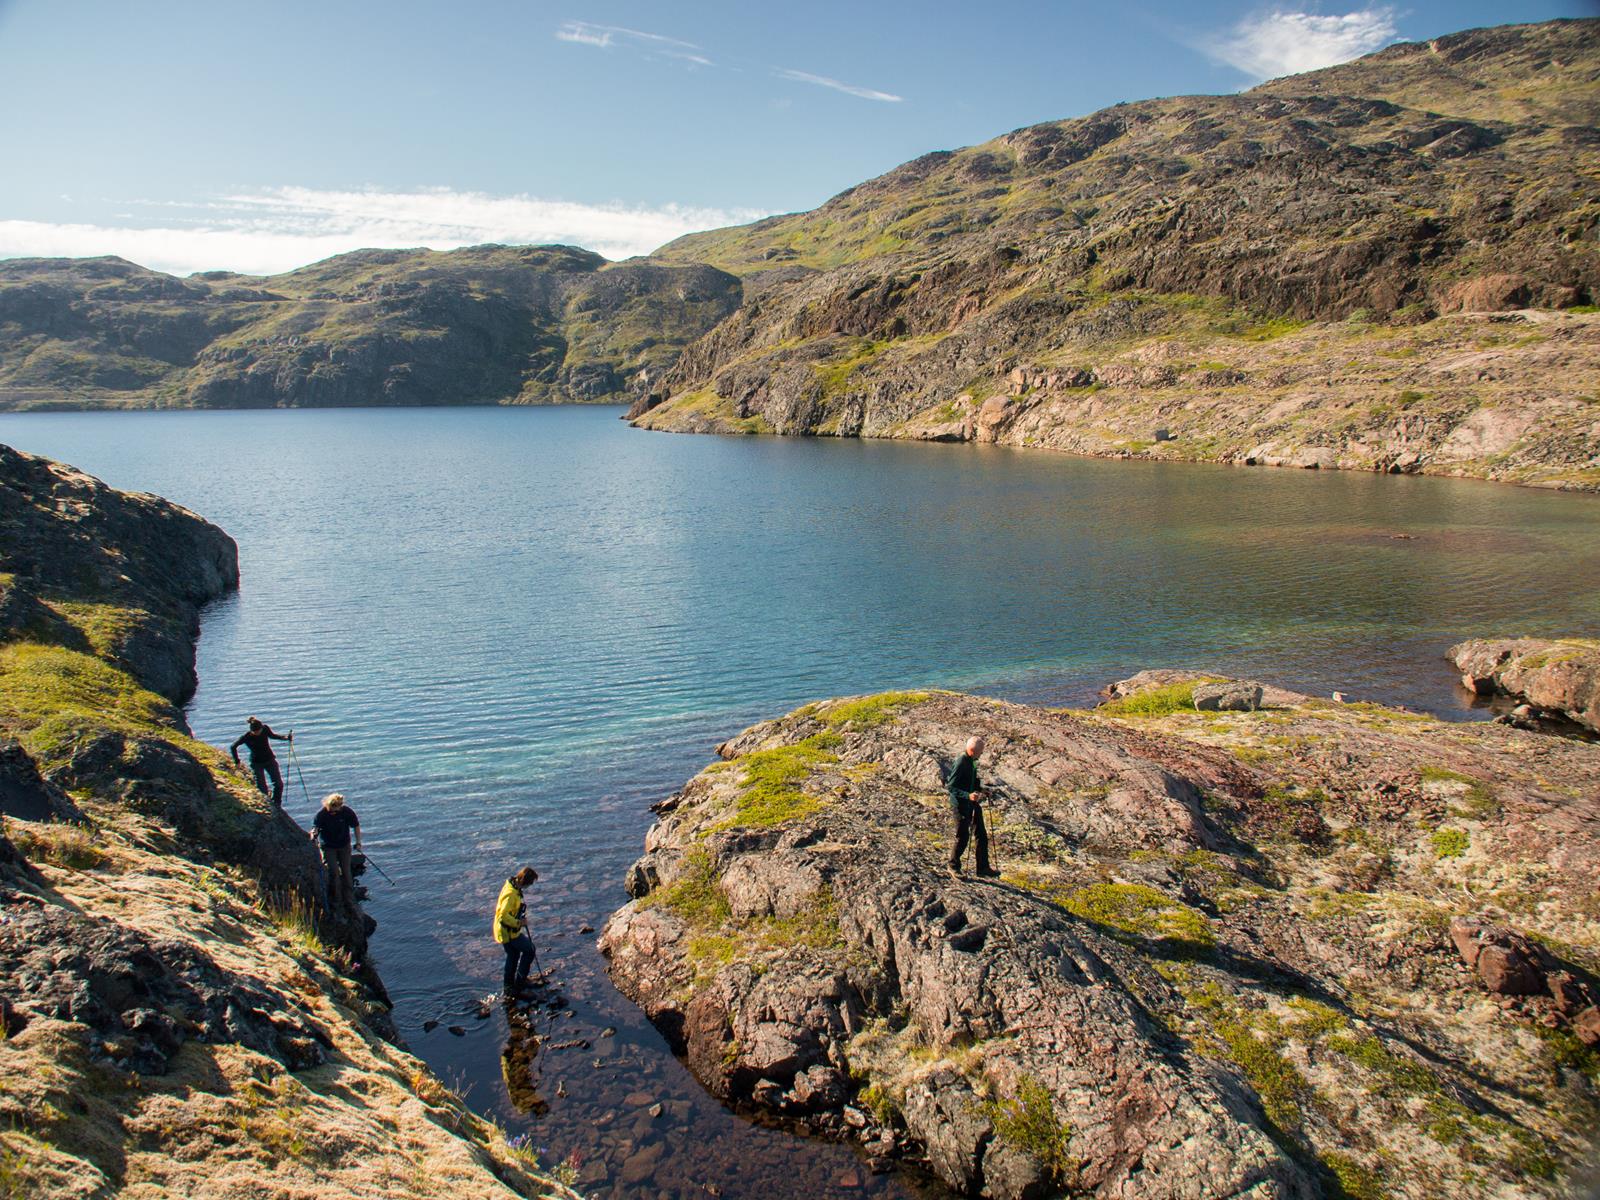
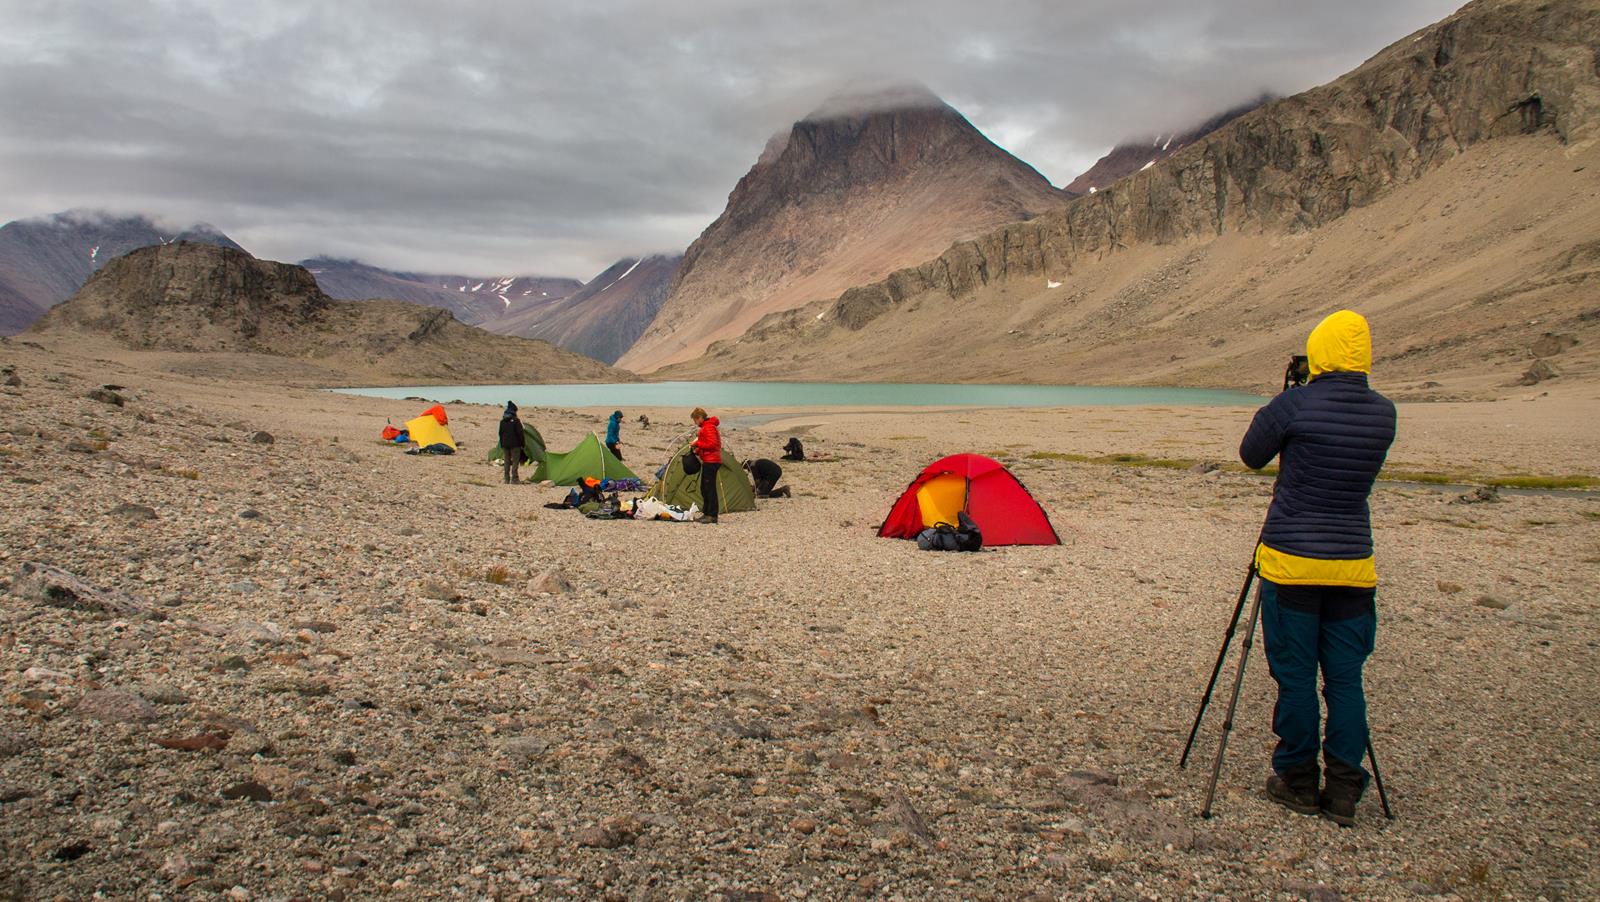
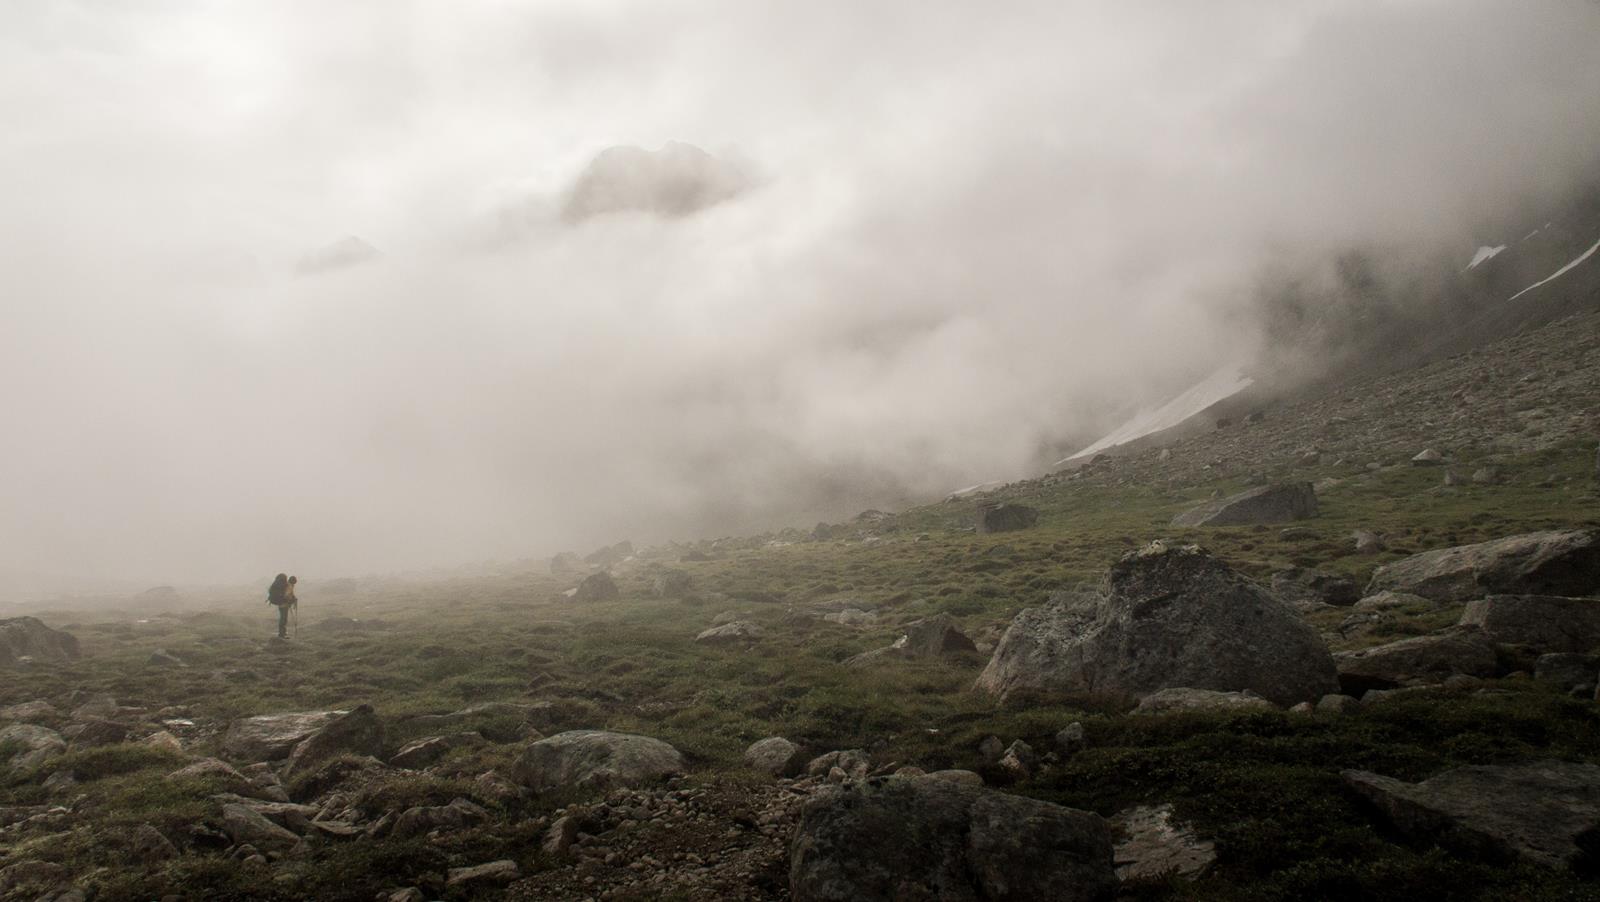
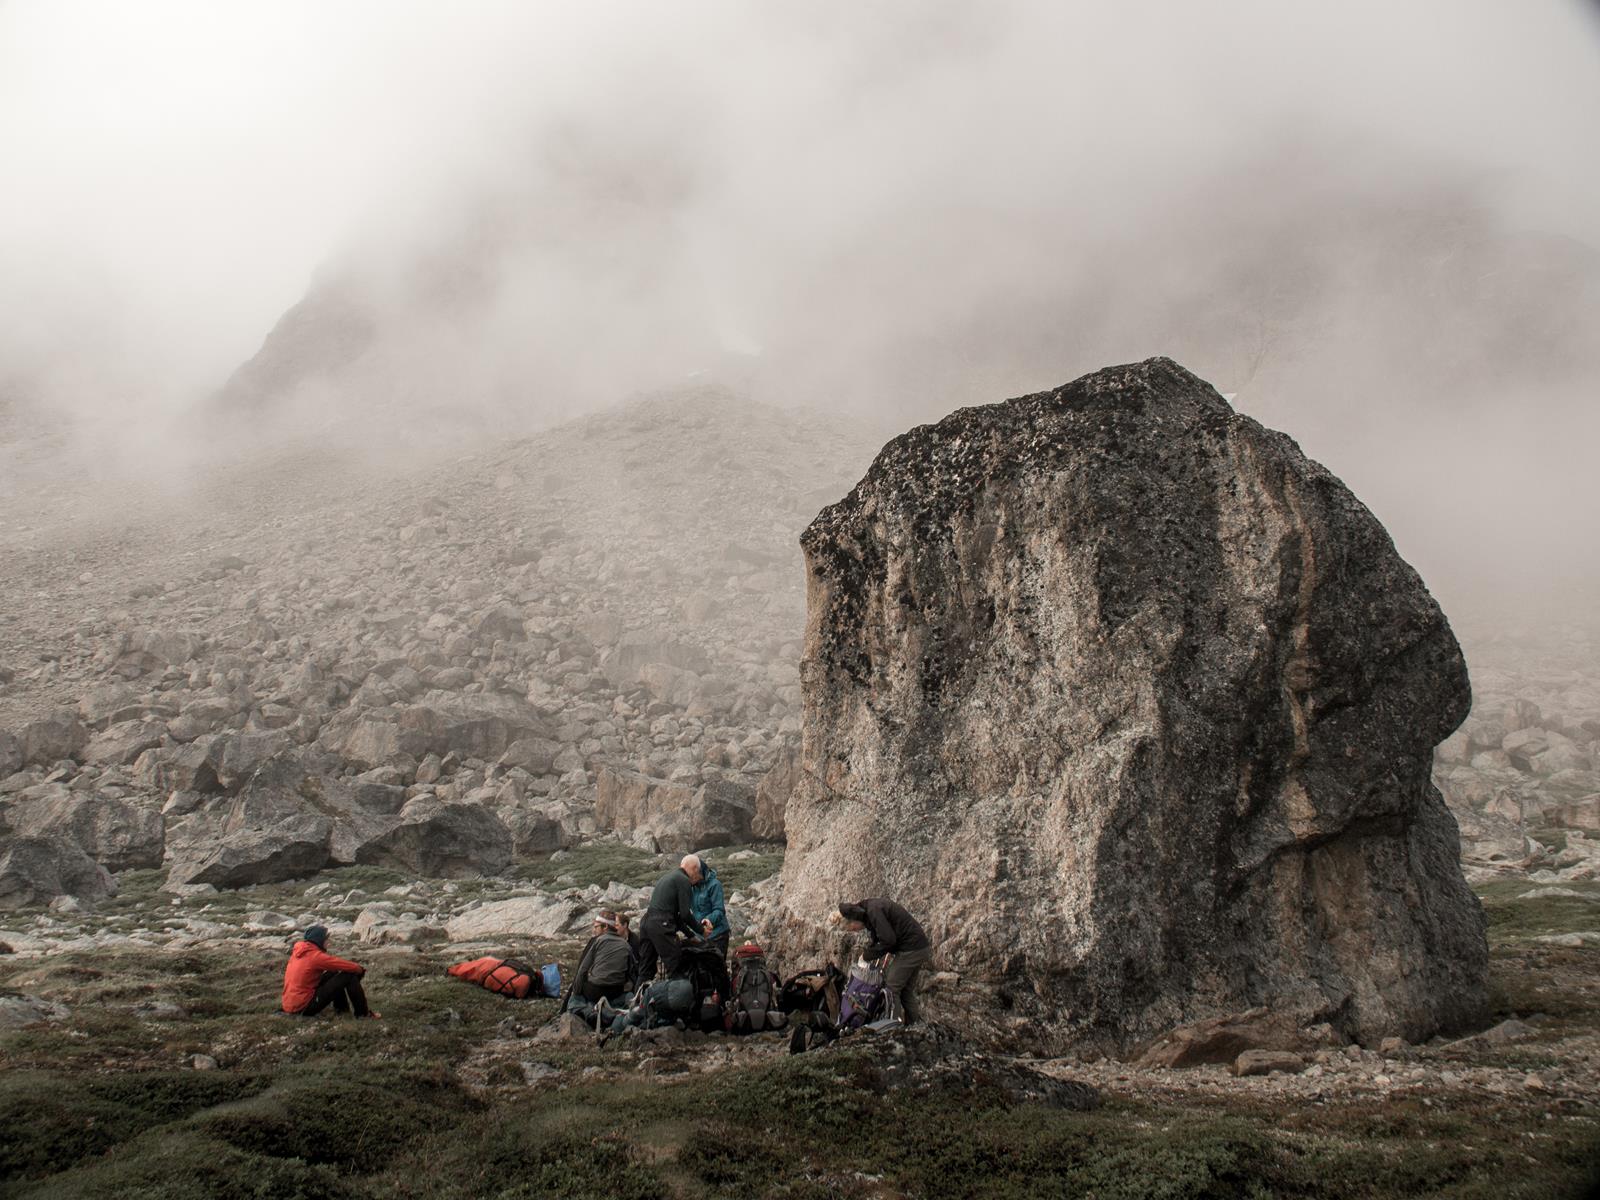
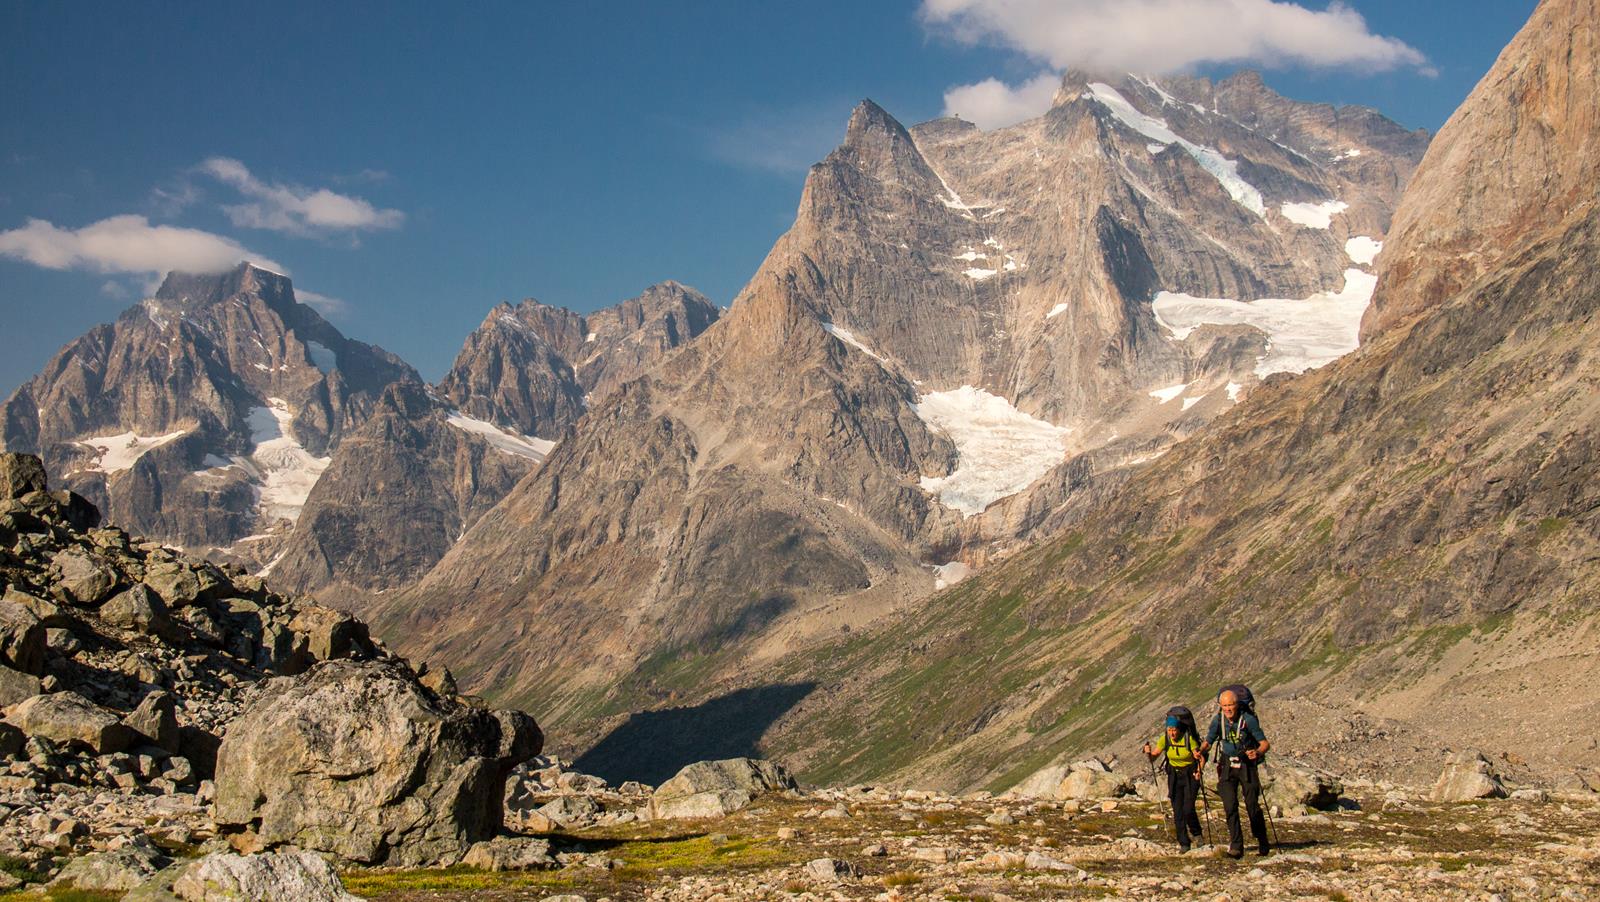
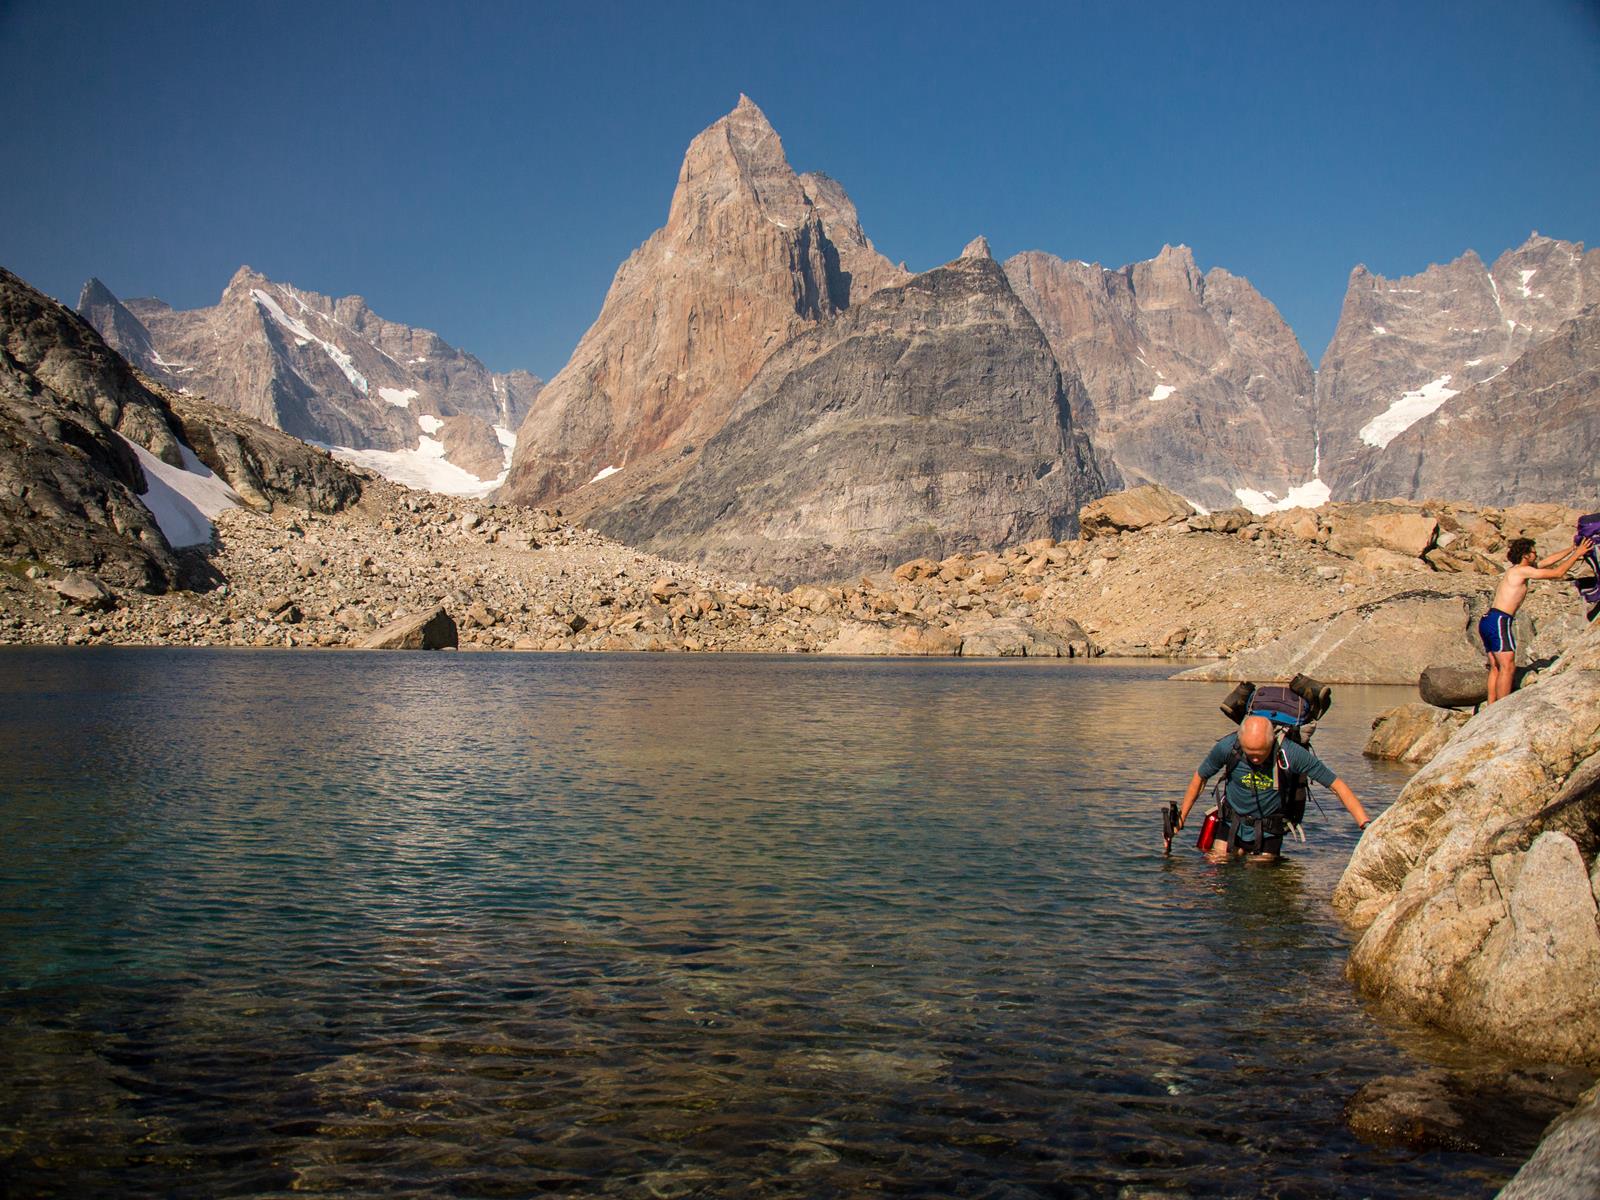
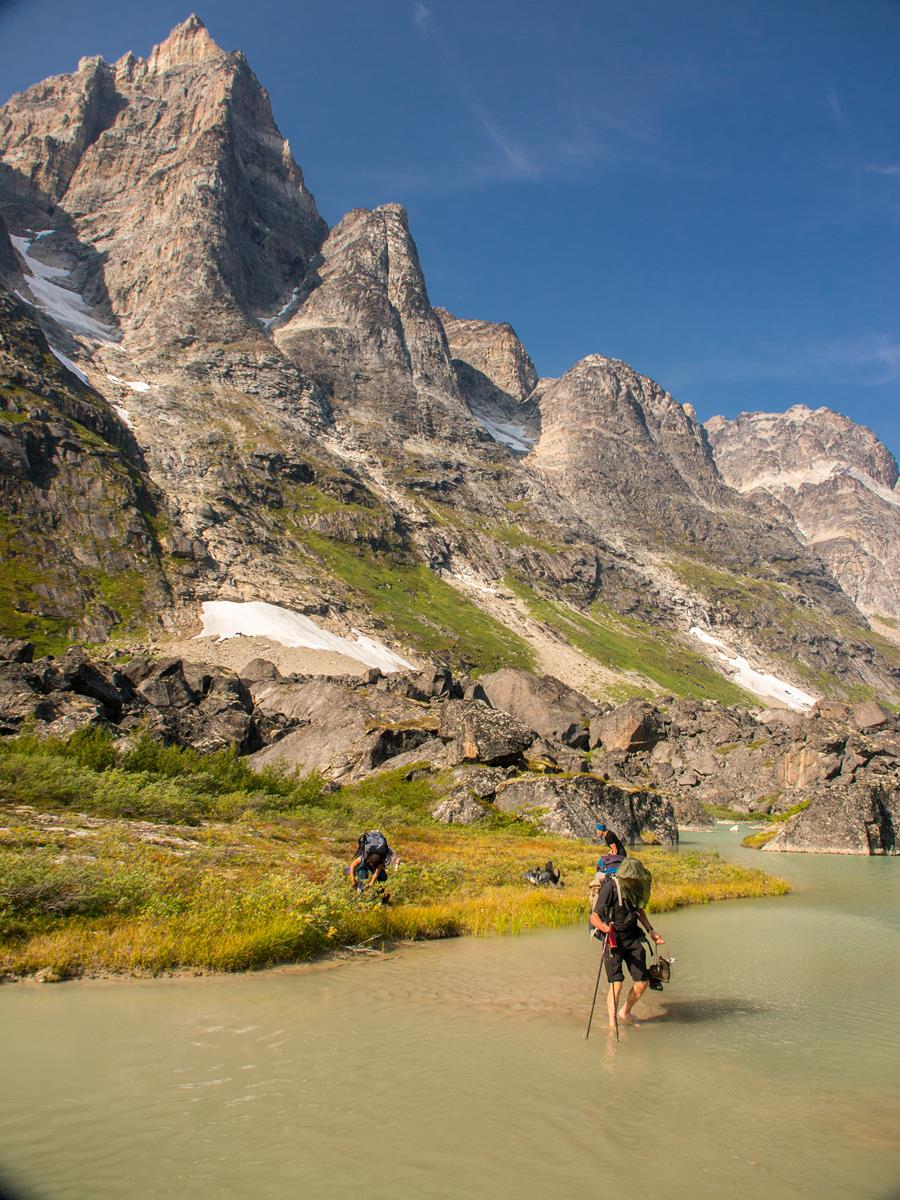
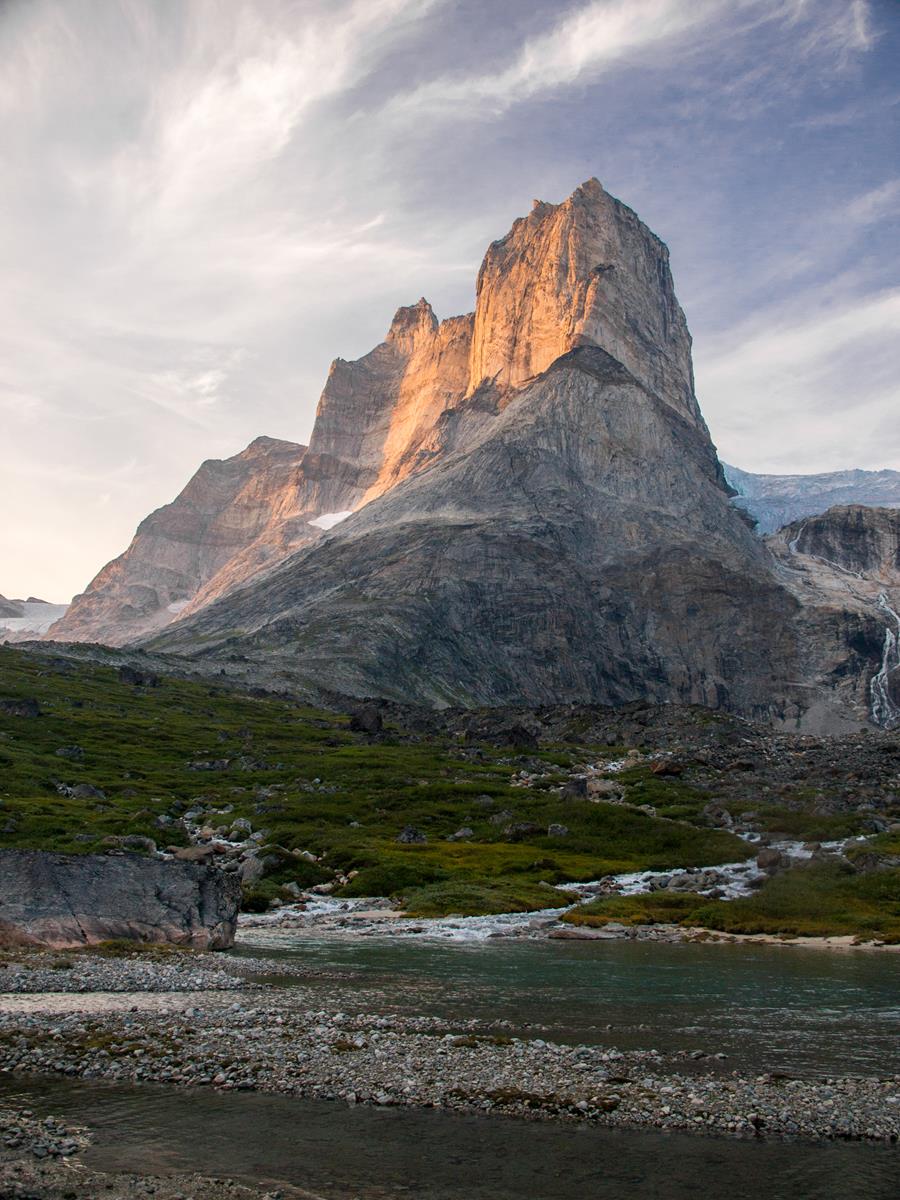
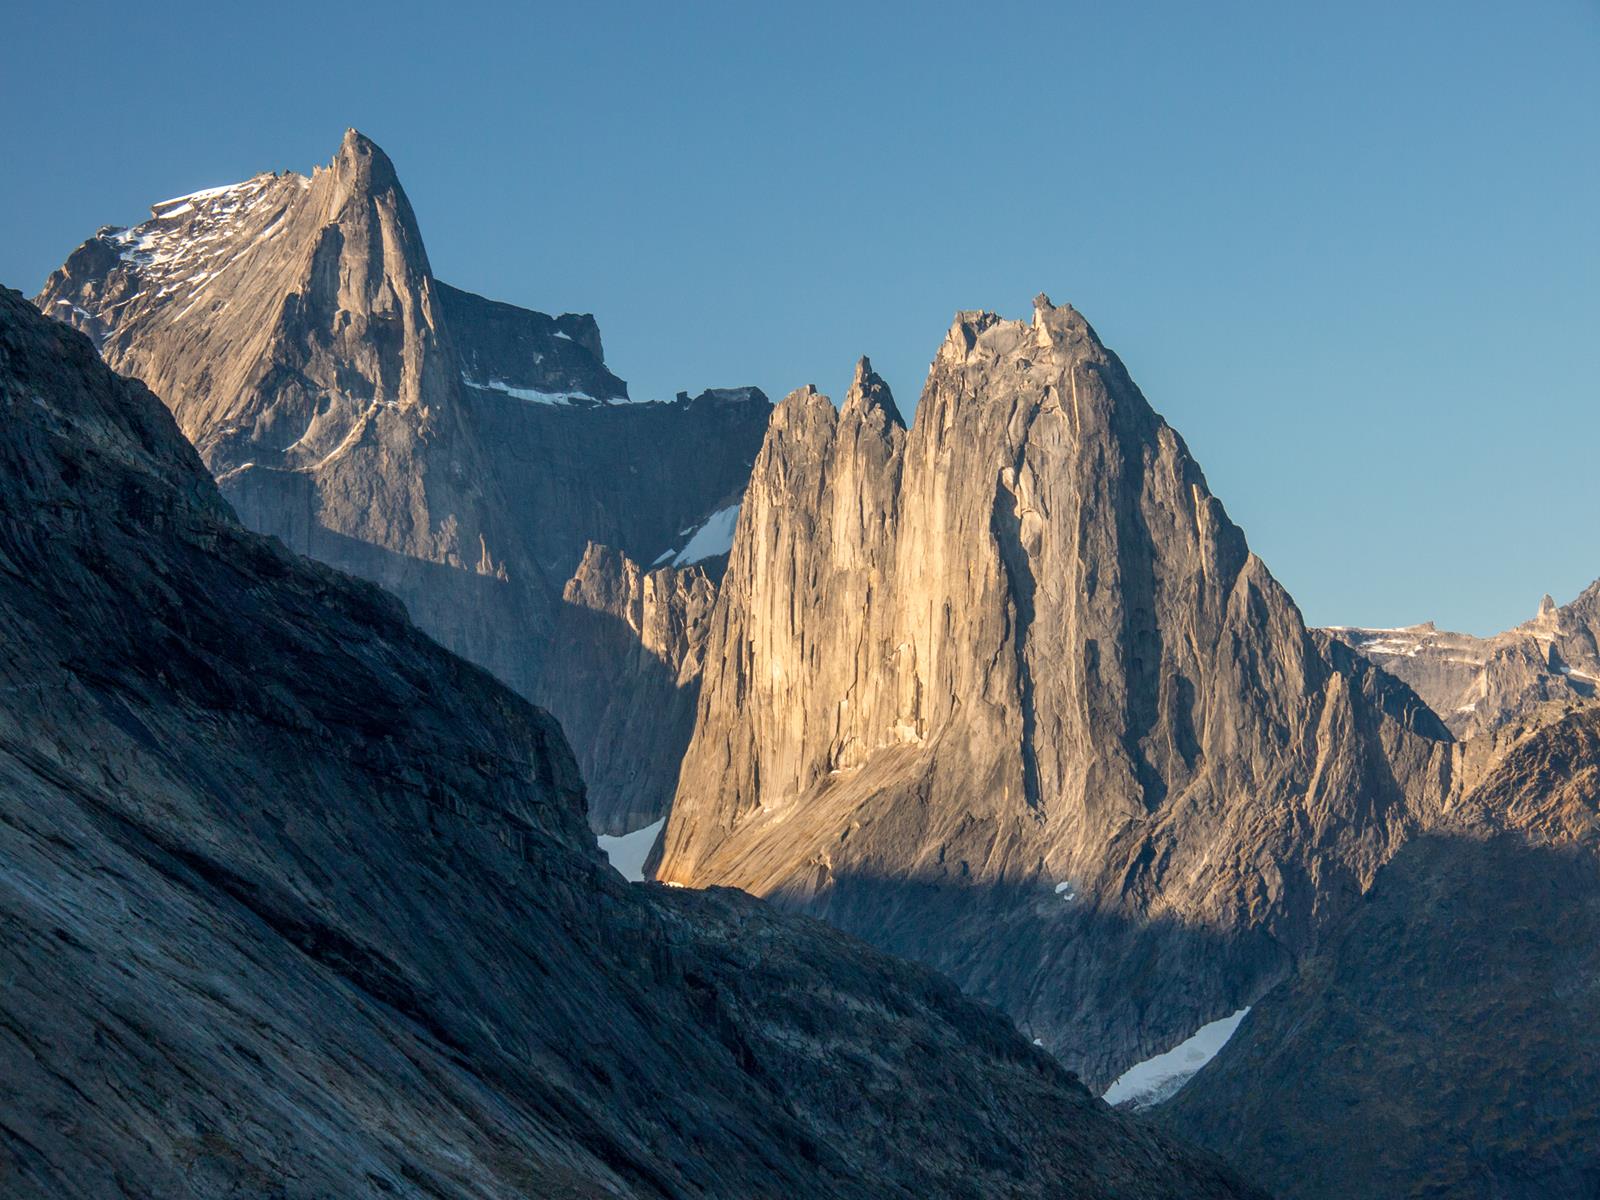
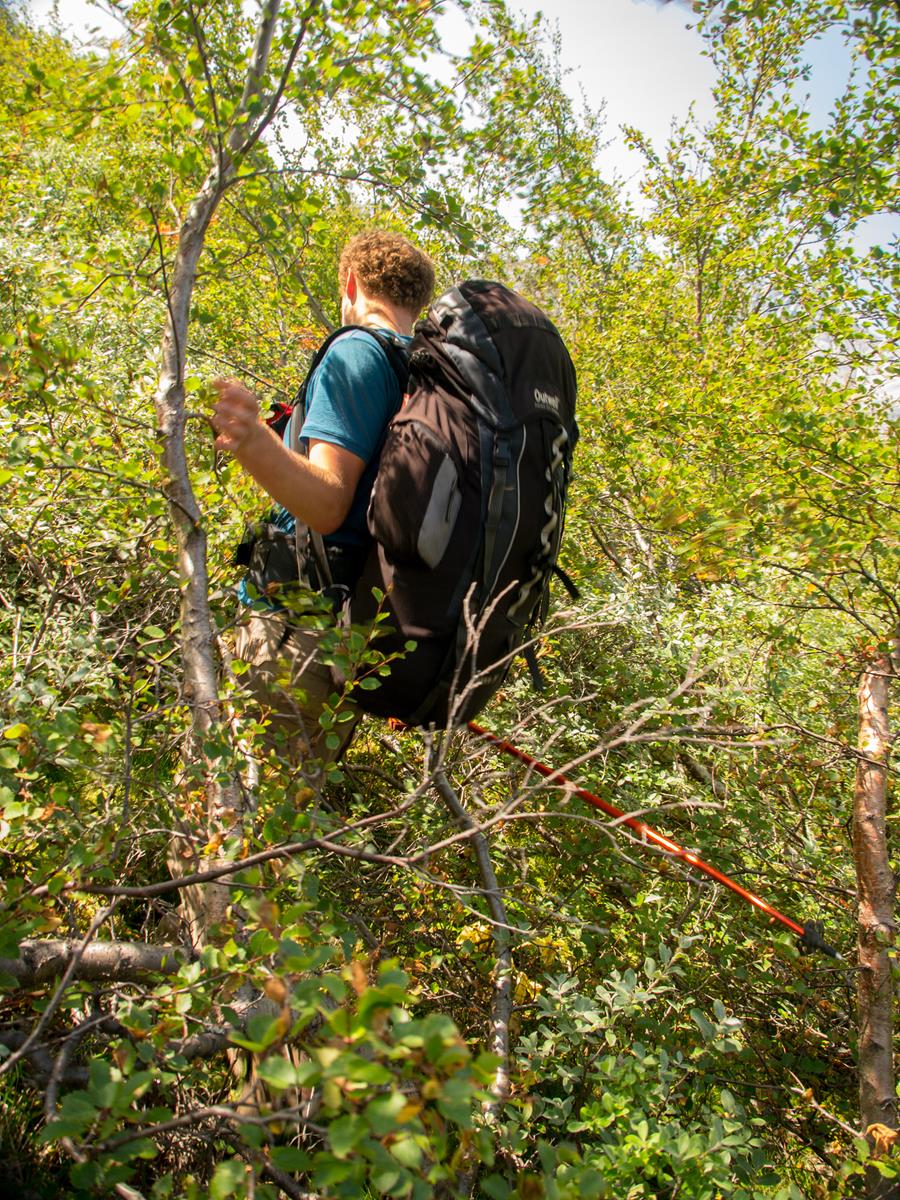
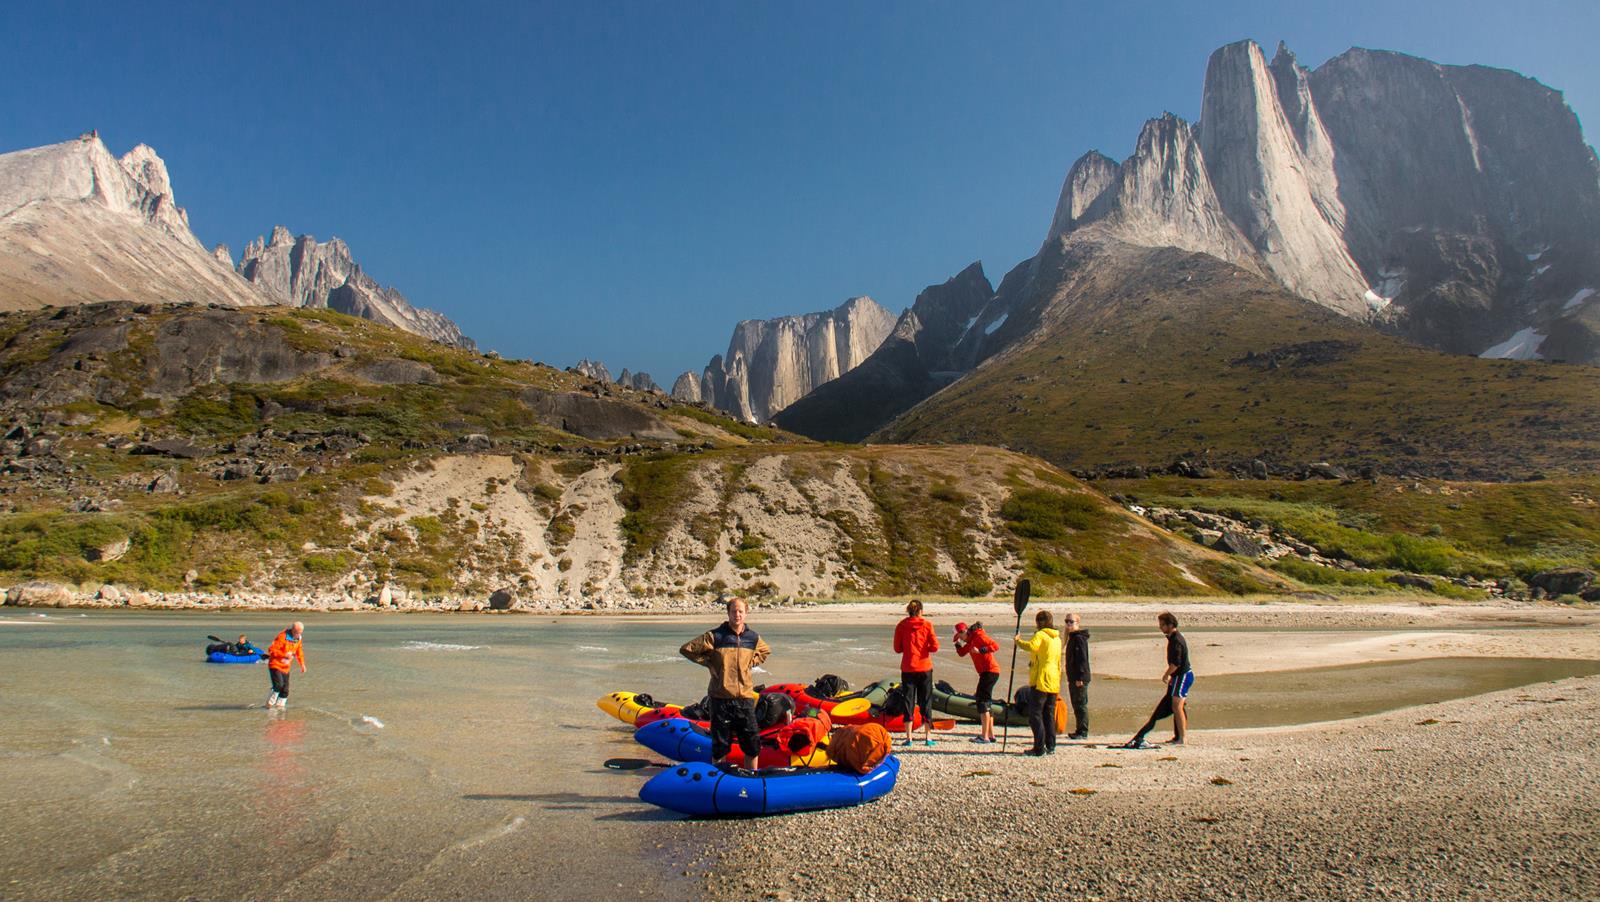
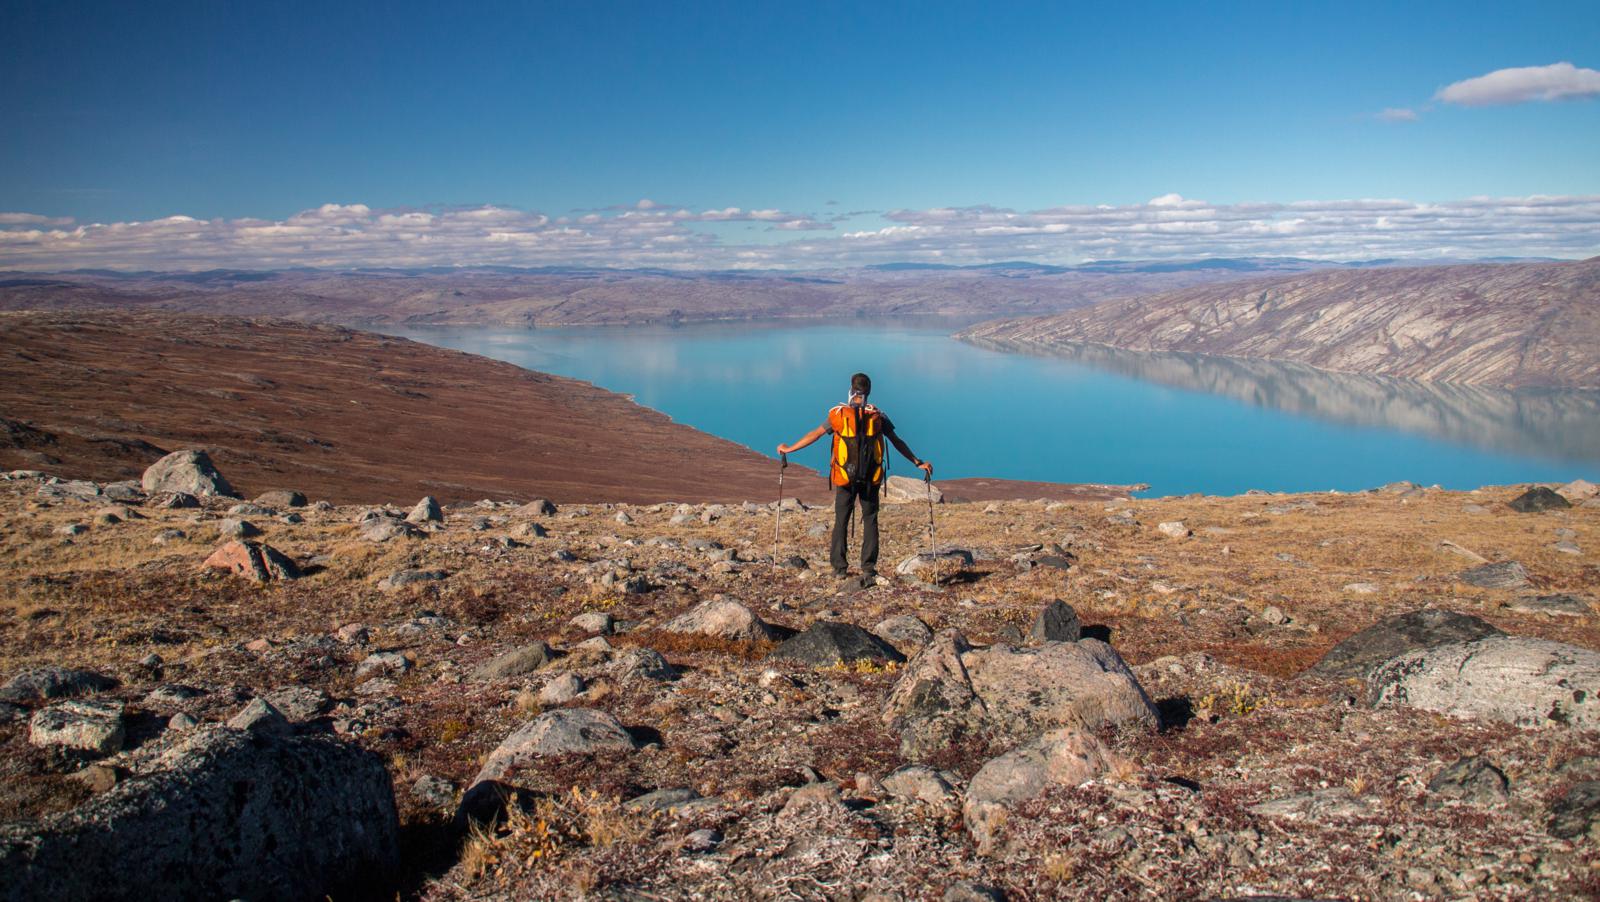
In mid-august I flew south to Narsarsuaq. After a short 3-day solo, a new strong group of hiker friends arrived for a series of 3 treks in the wildest accessible areas in South Greenland: first a 3-day hike on between massive glaciers on Mellemlandet, then a 4-day hike with often bad weather near Igaliku, and finally a long and difficult 9-day trek through some of South Greenland’s wildest valleys near Tasermiut fjord, with many kilometers of serious bushwhacking and difficult boulderfields. This last trip was blessed with incredible weather. I knew the area from my long Greenland adventure in 2013 – and still find it one of the most varied an wild places I have ever hiked.
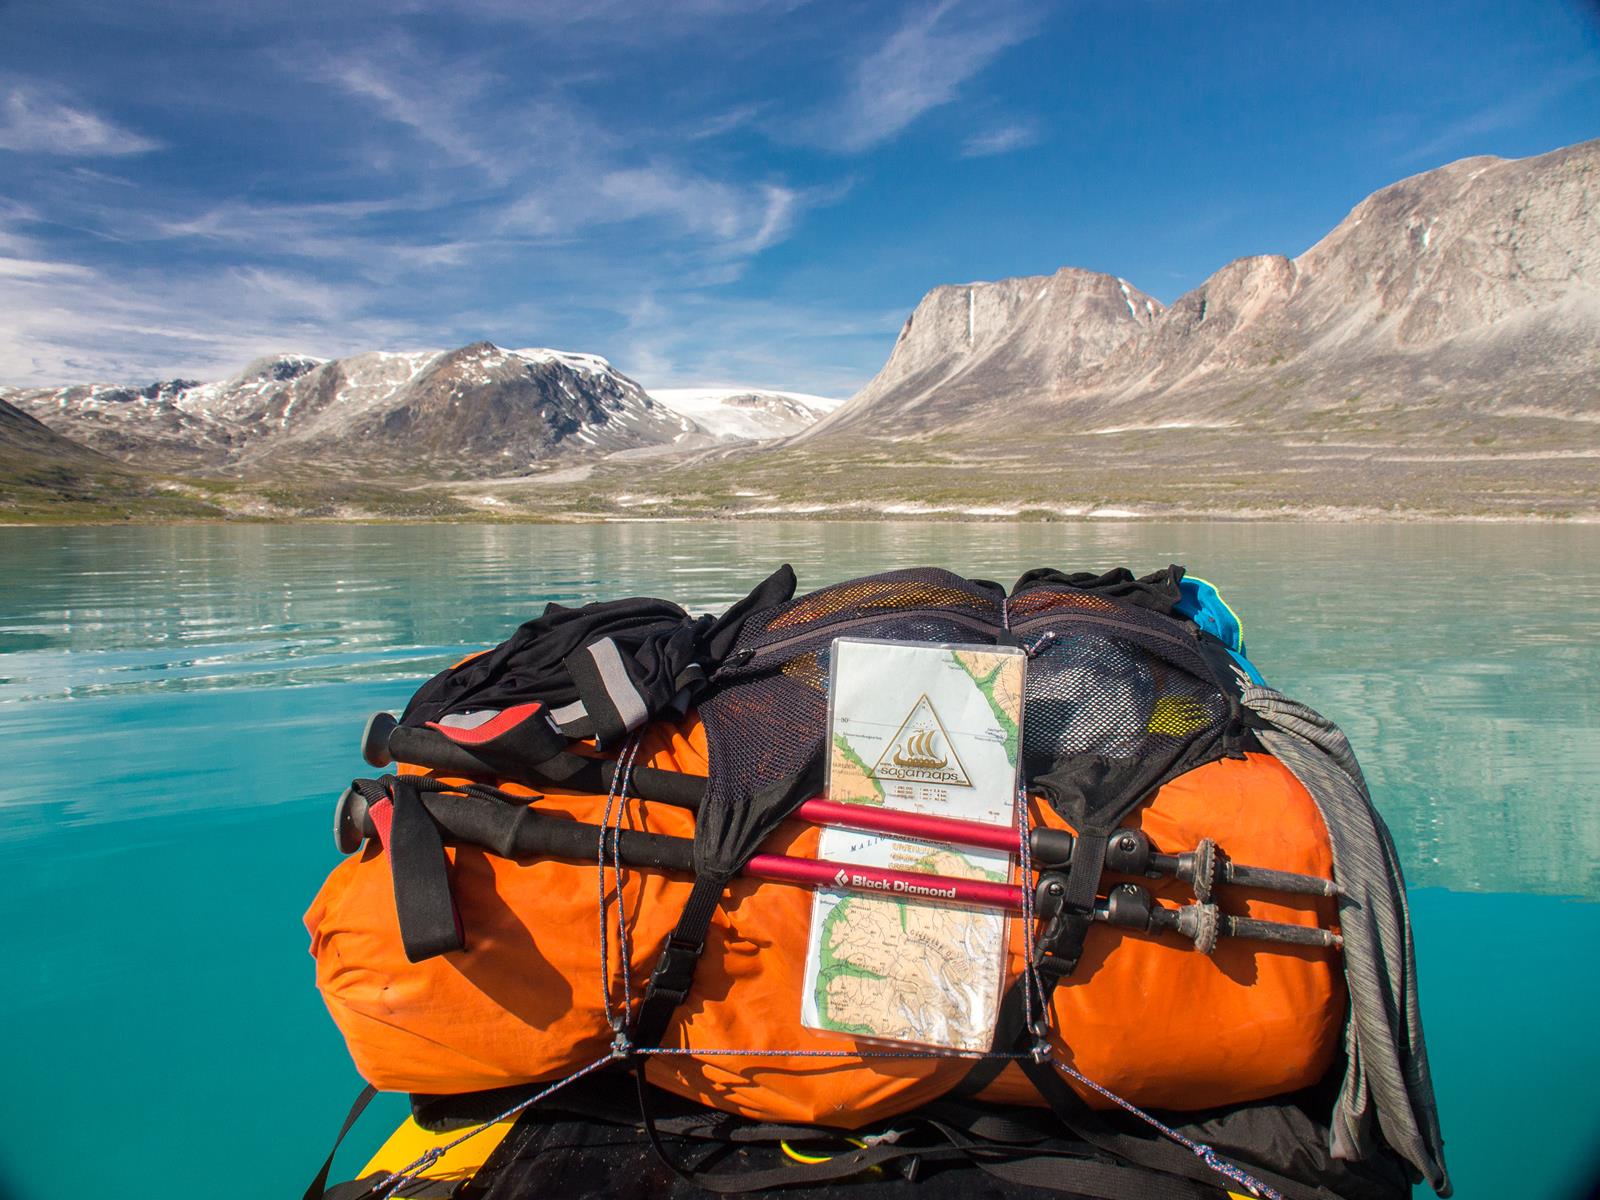
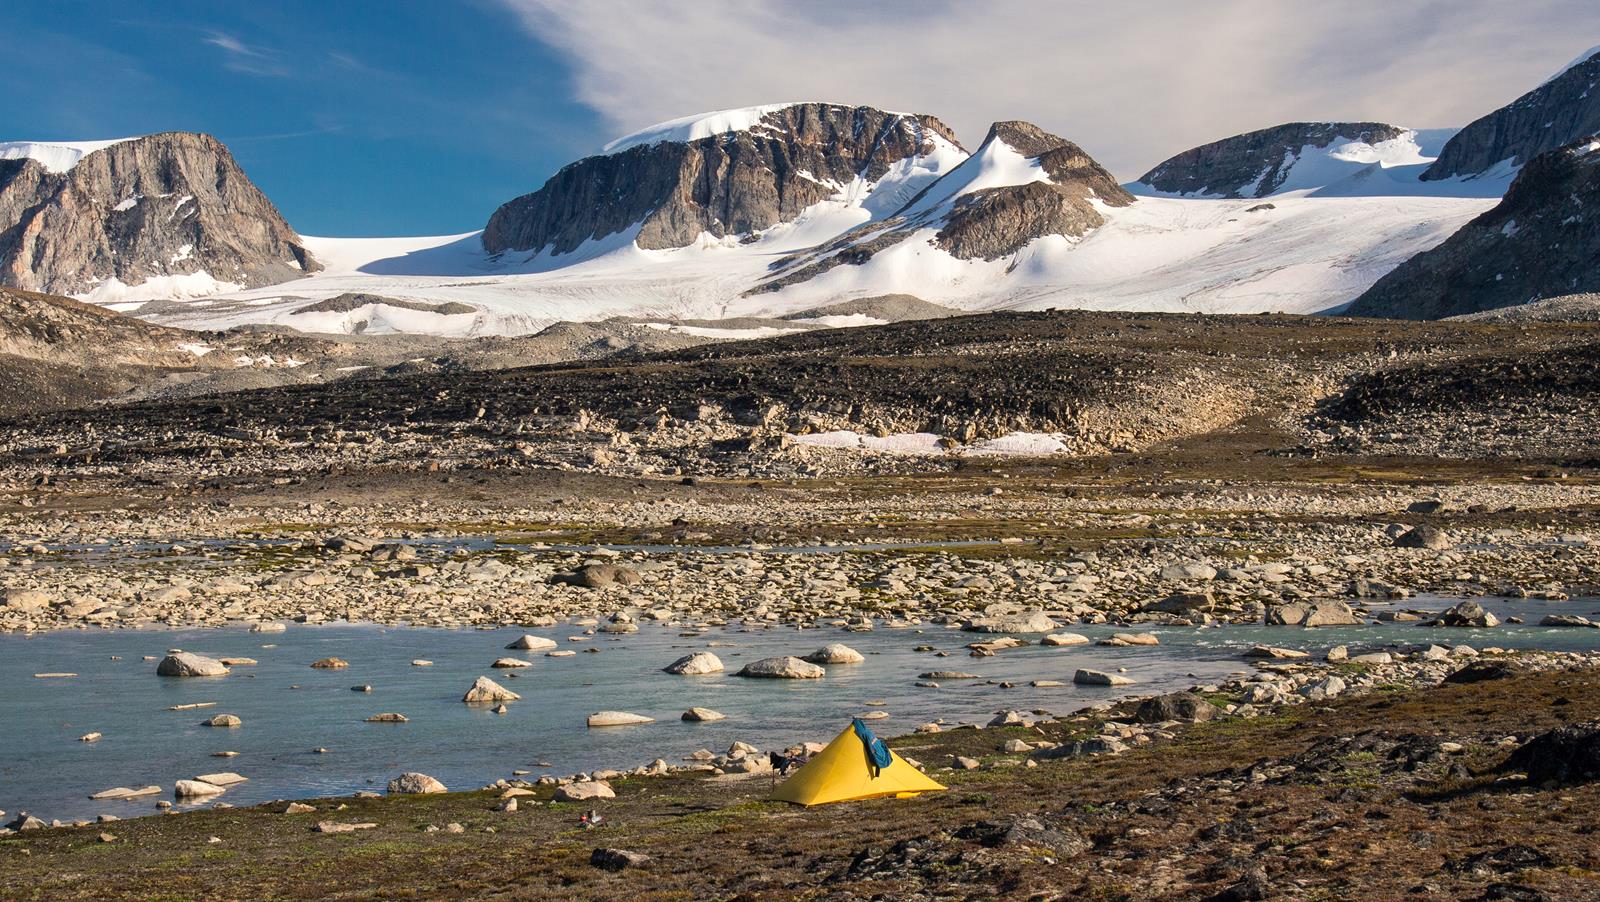
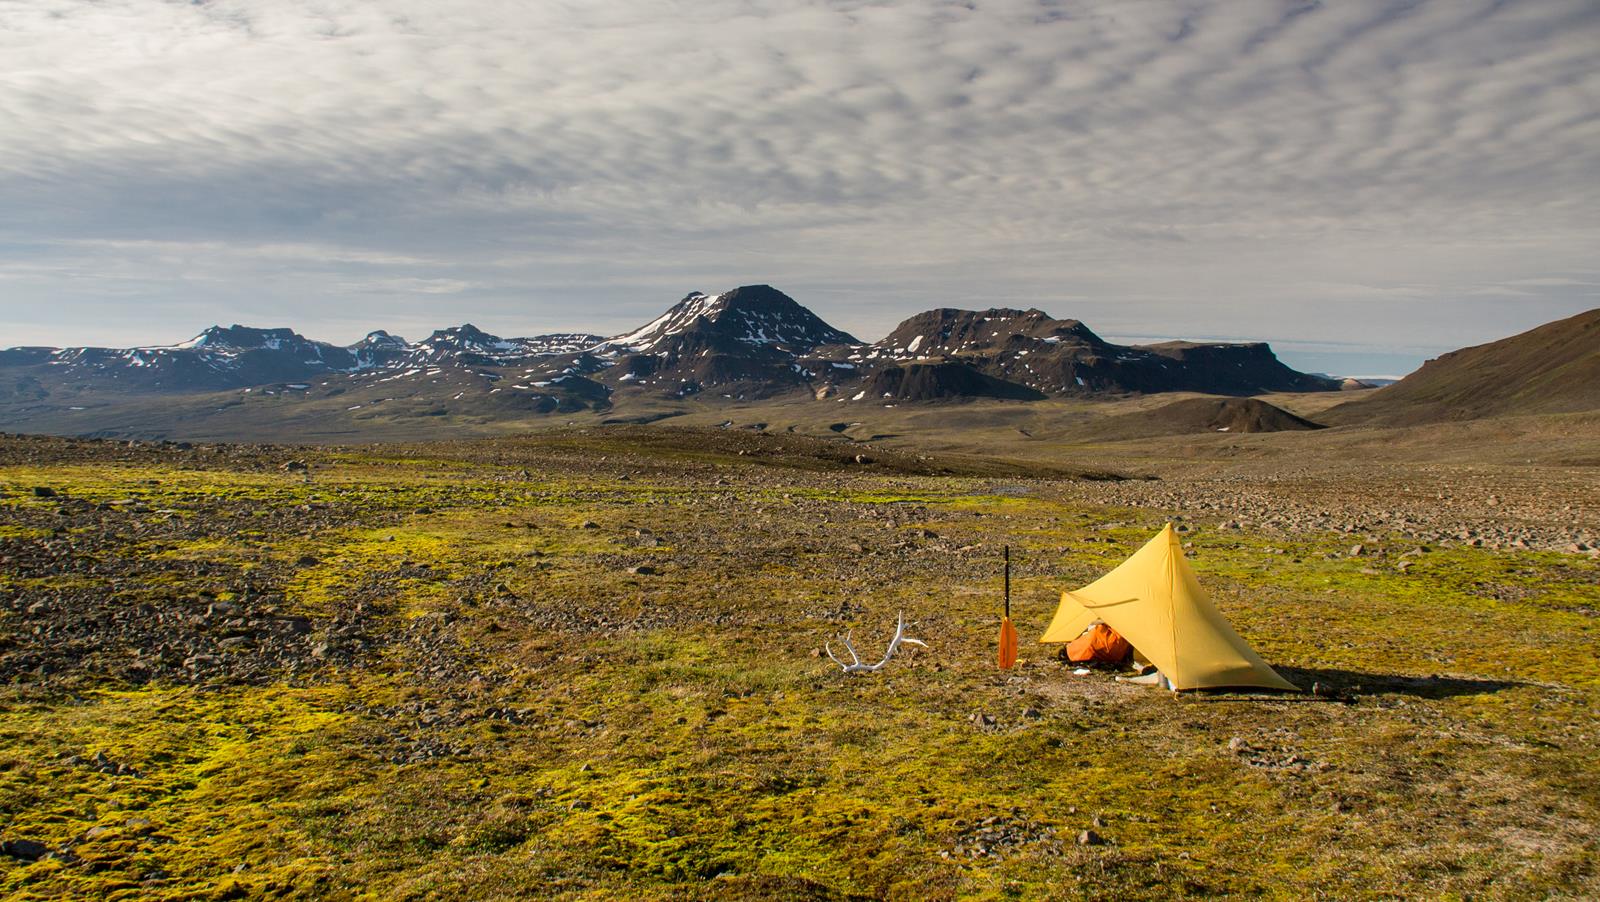
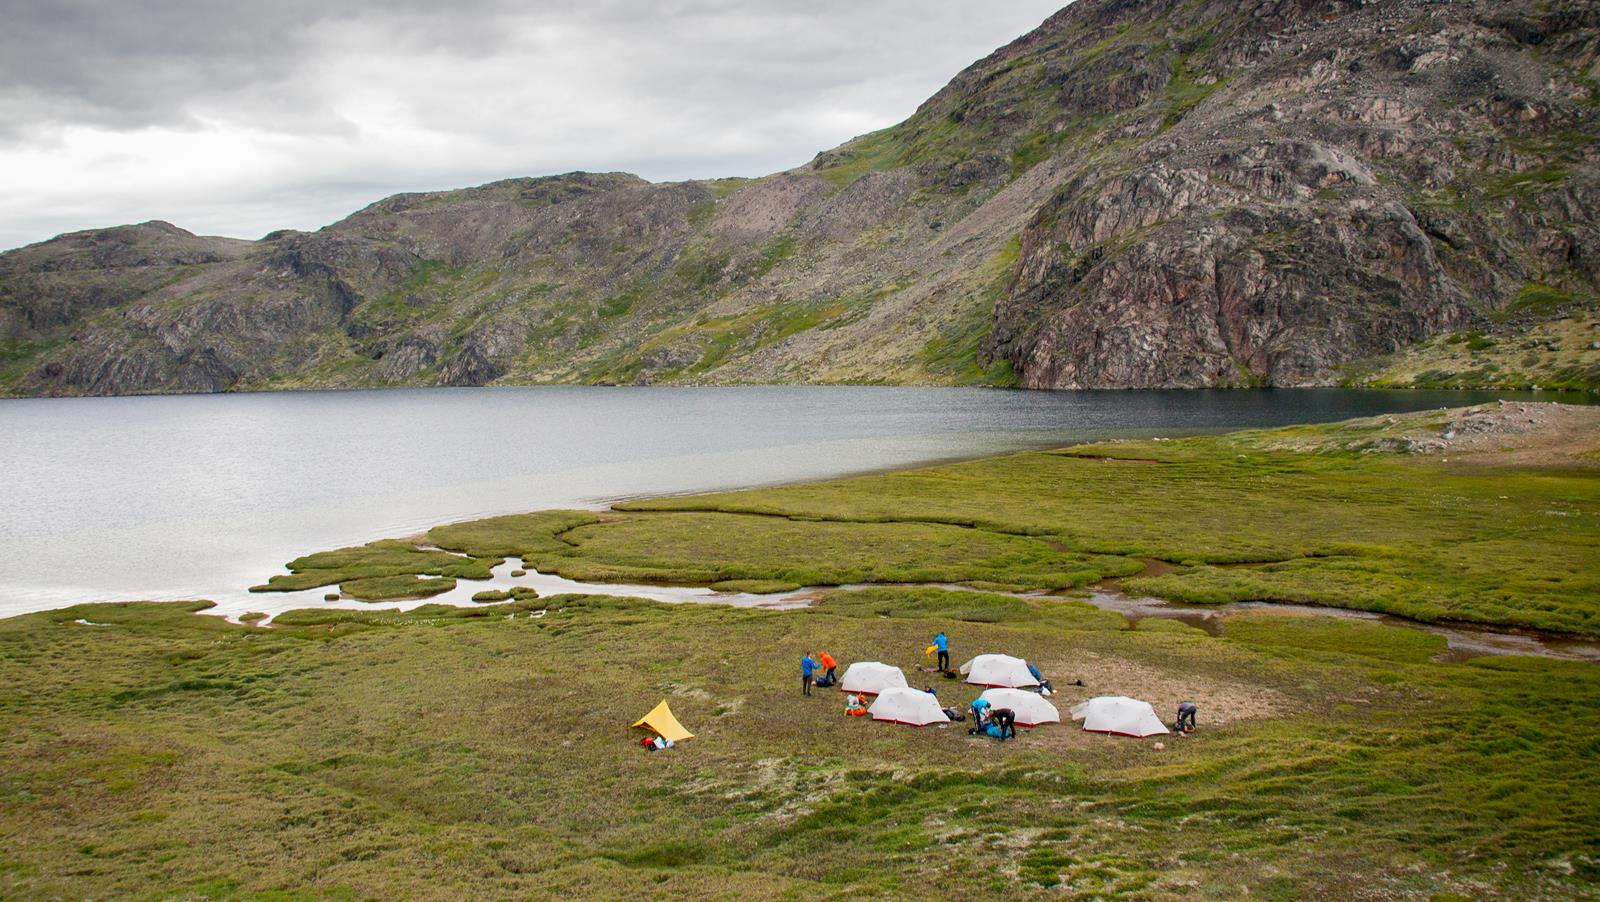
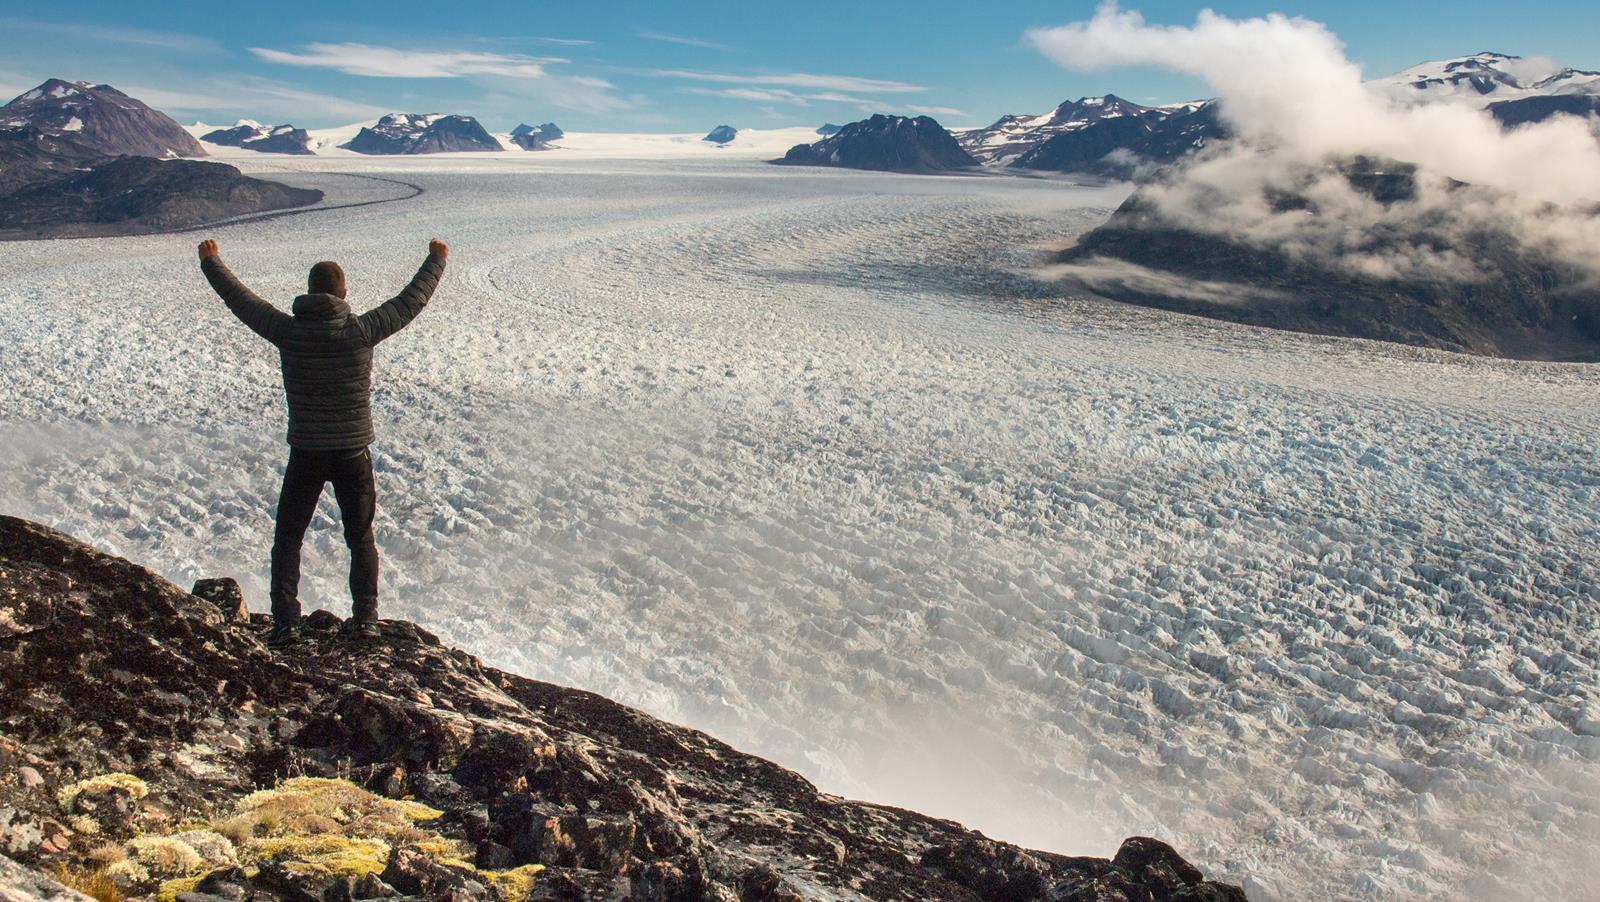
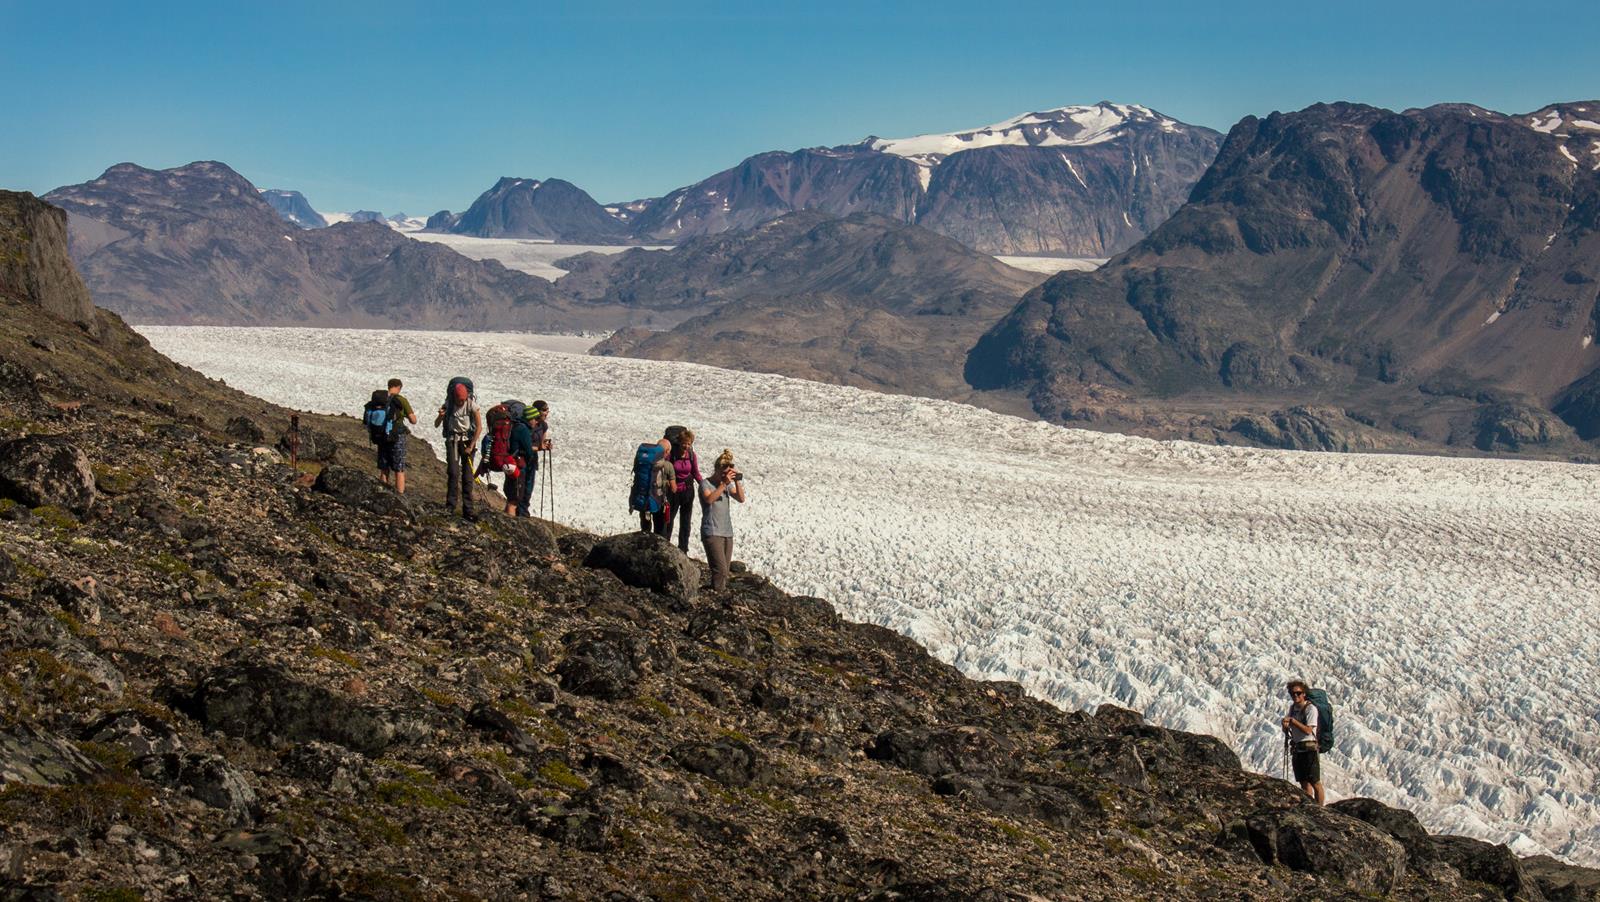
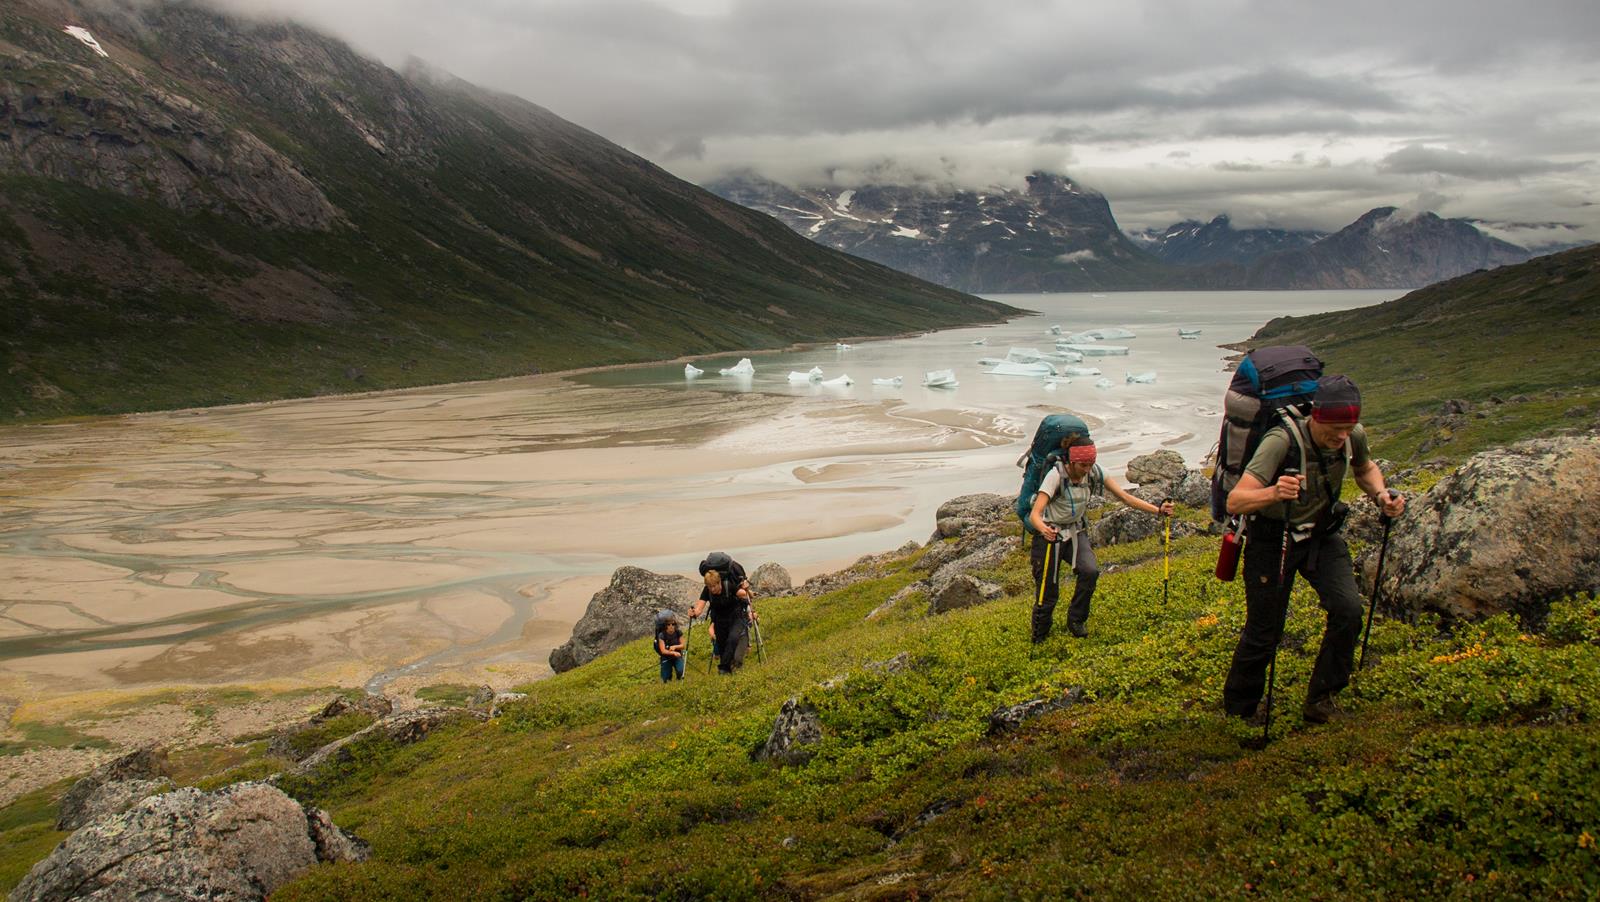
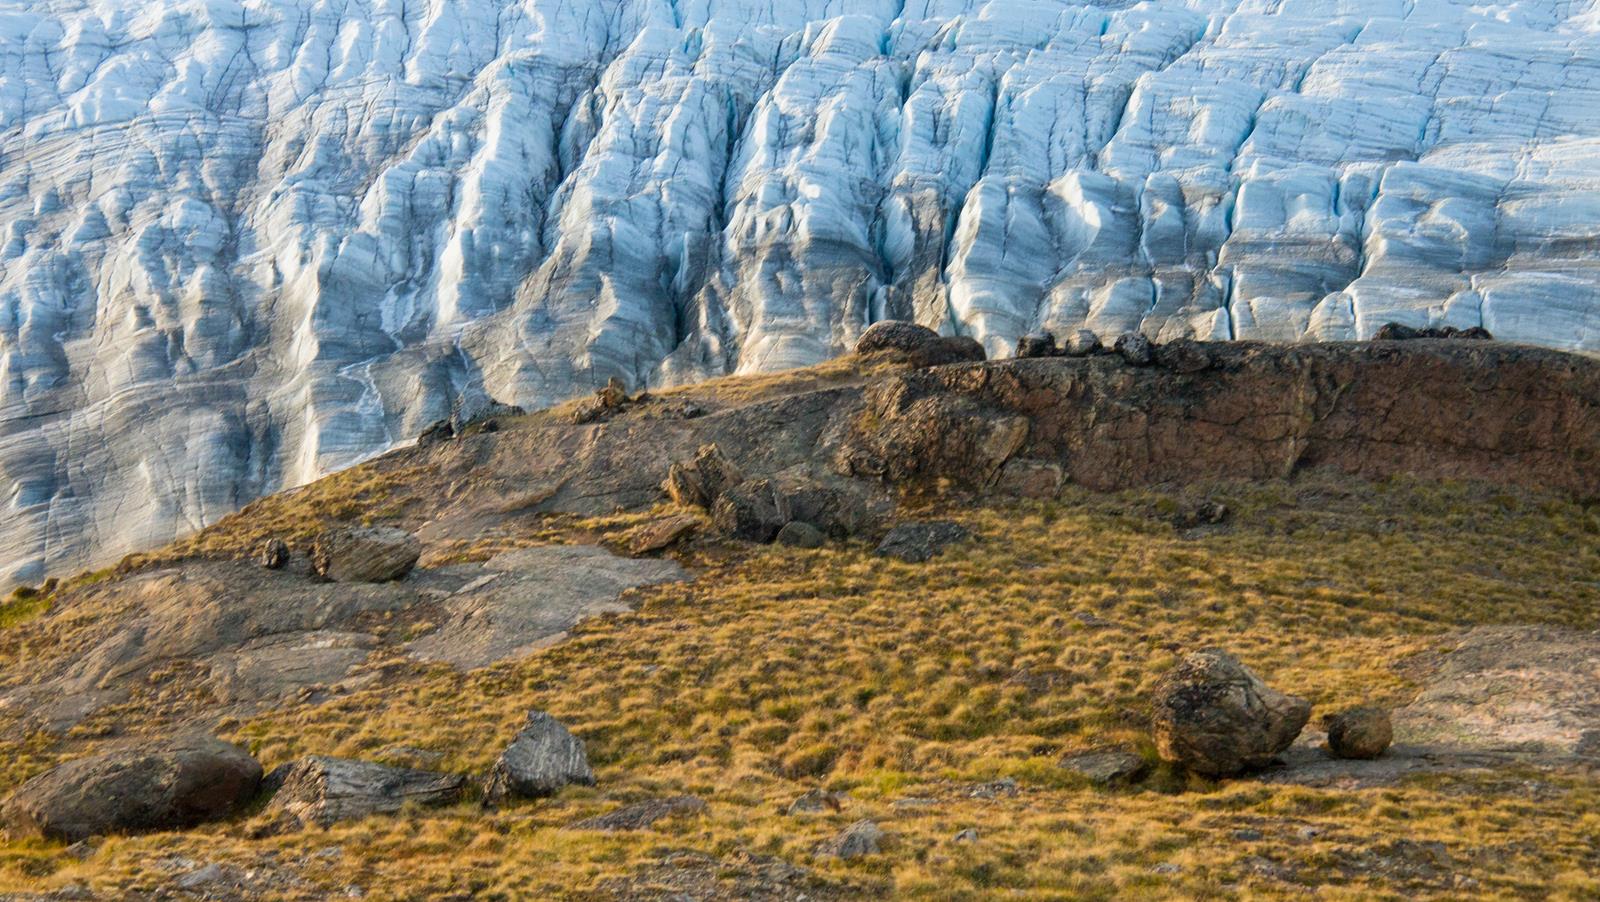
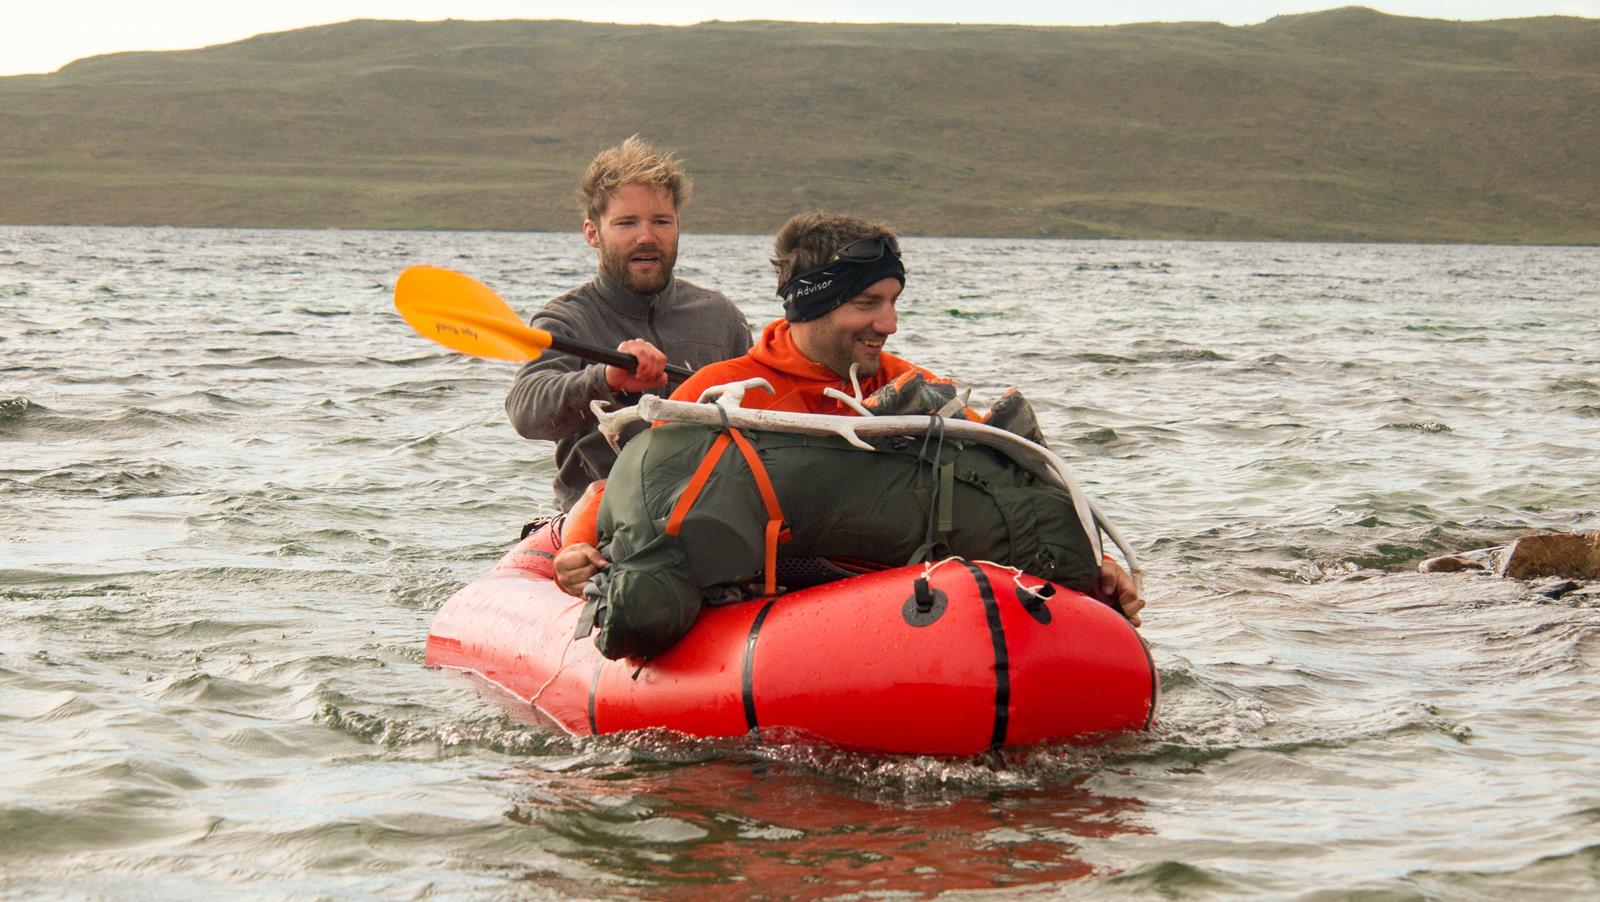
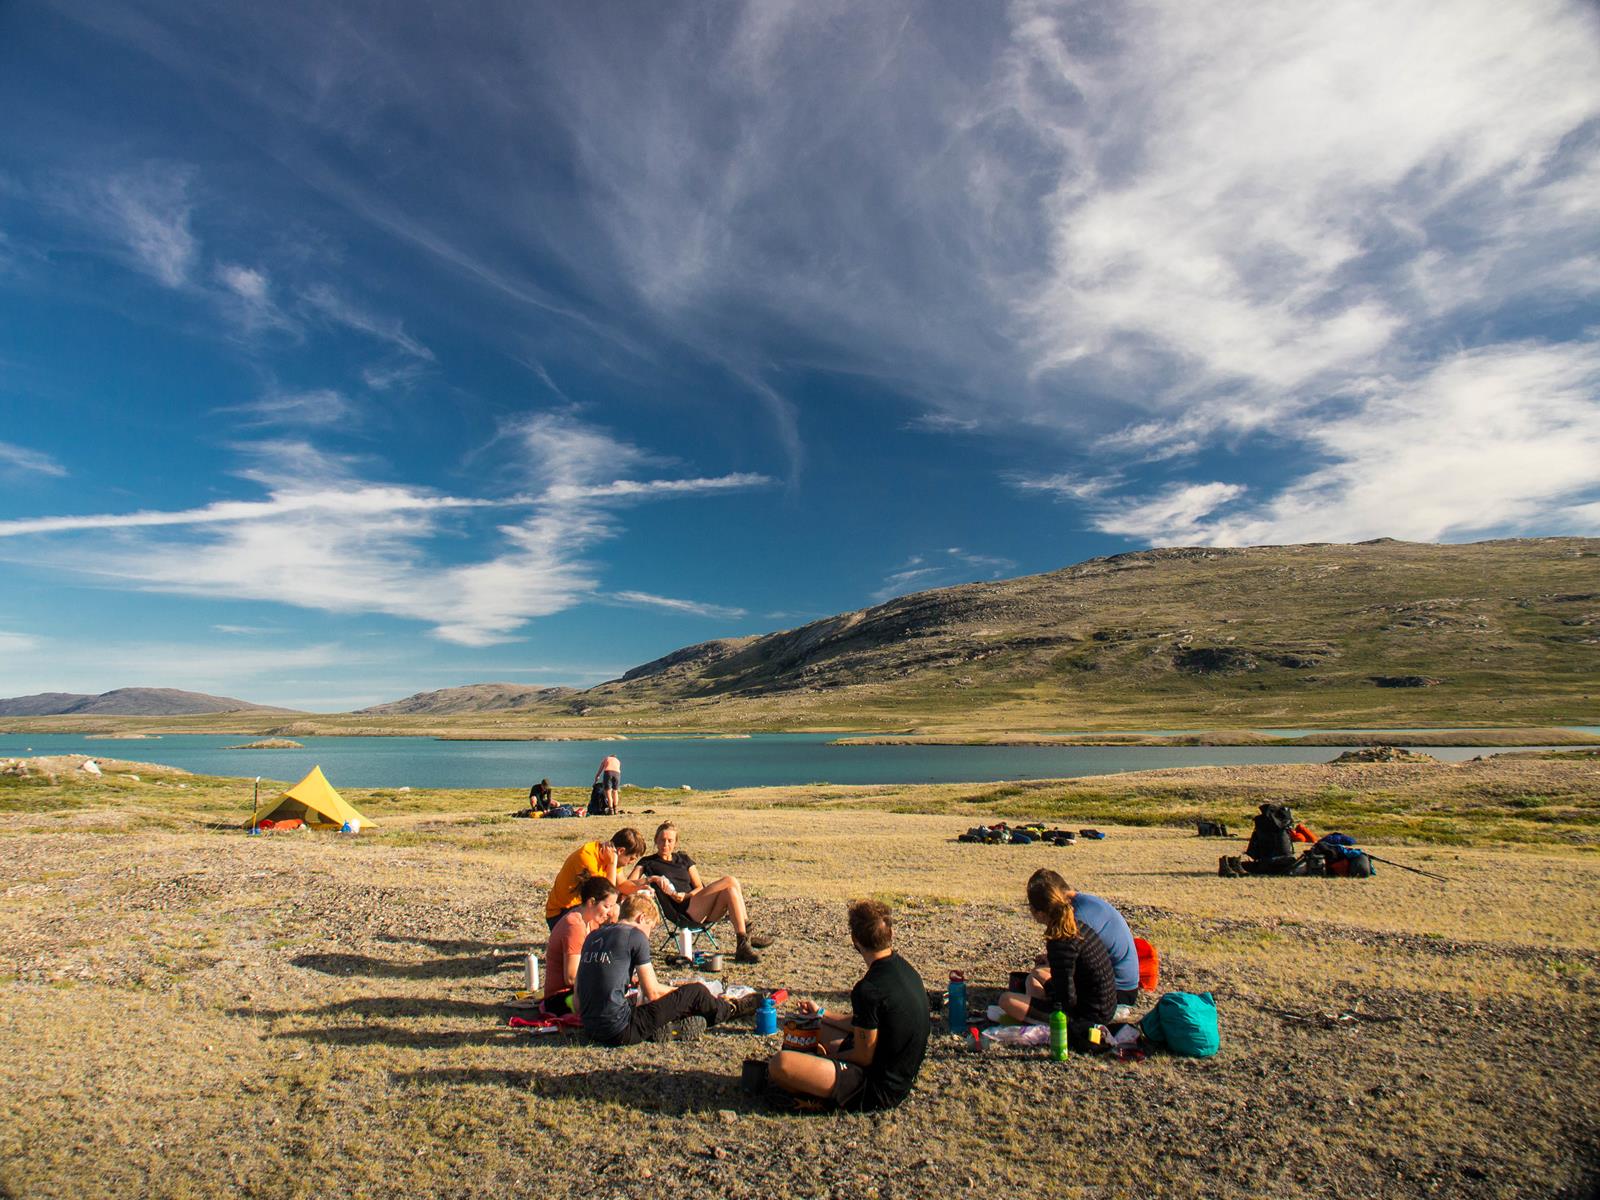
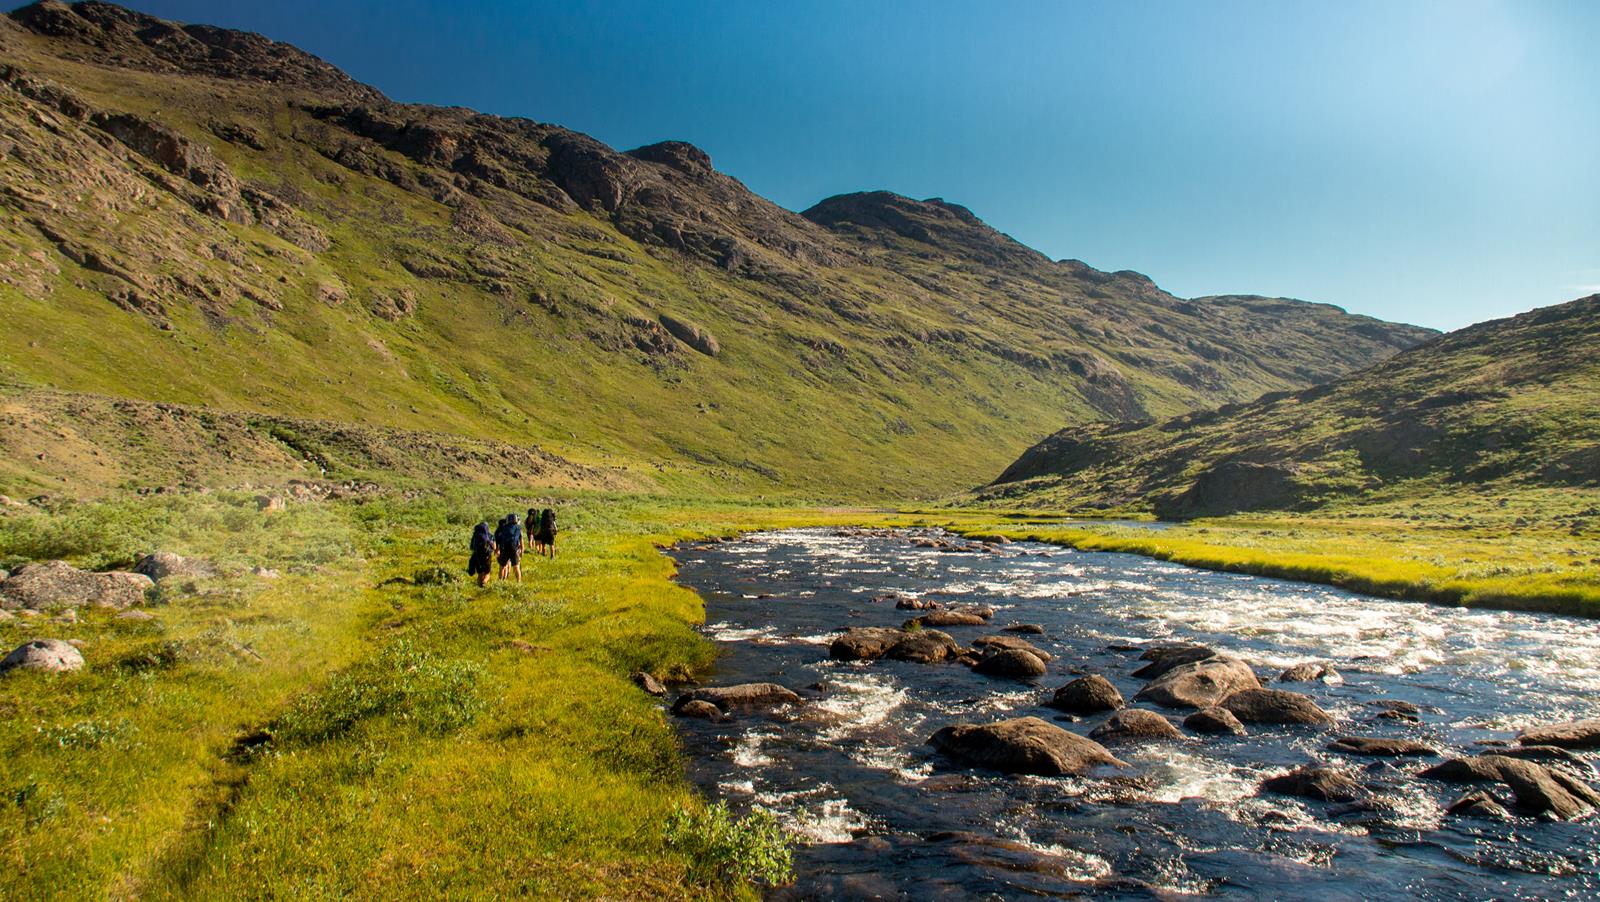
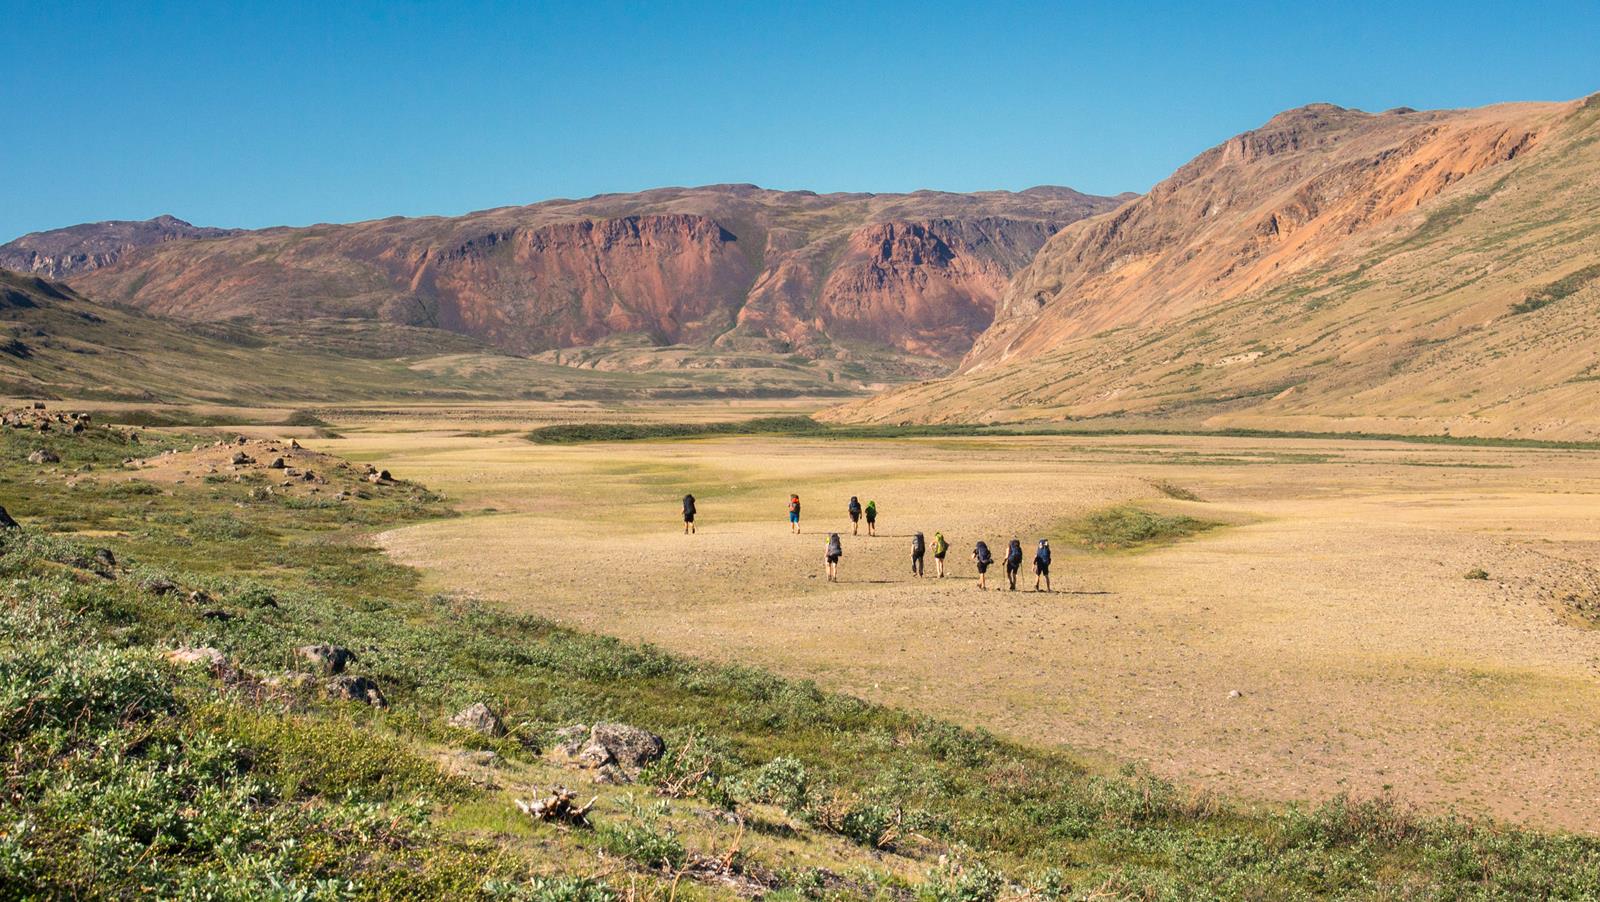
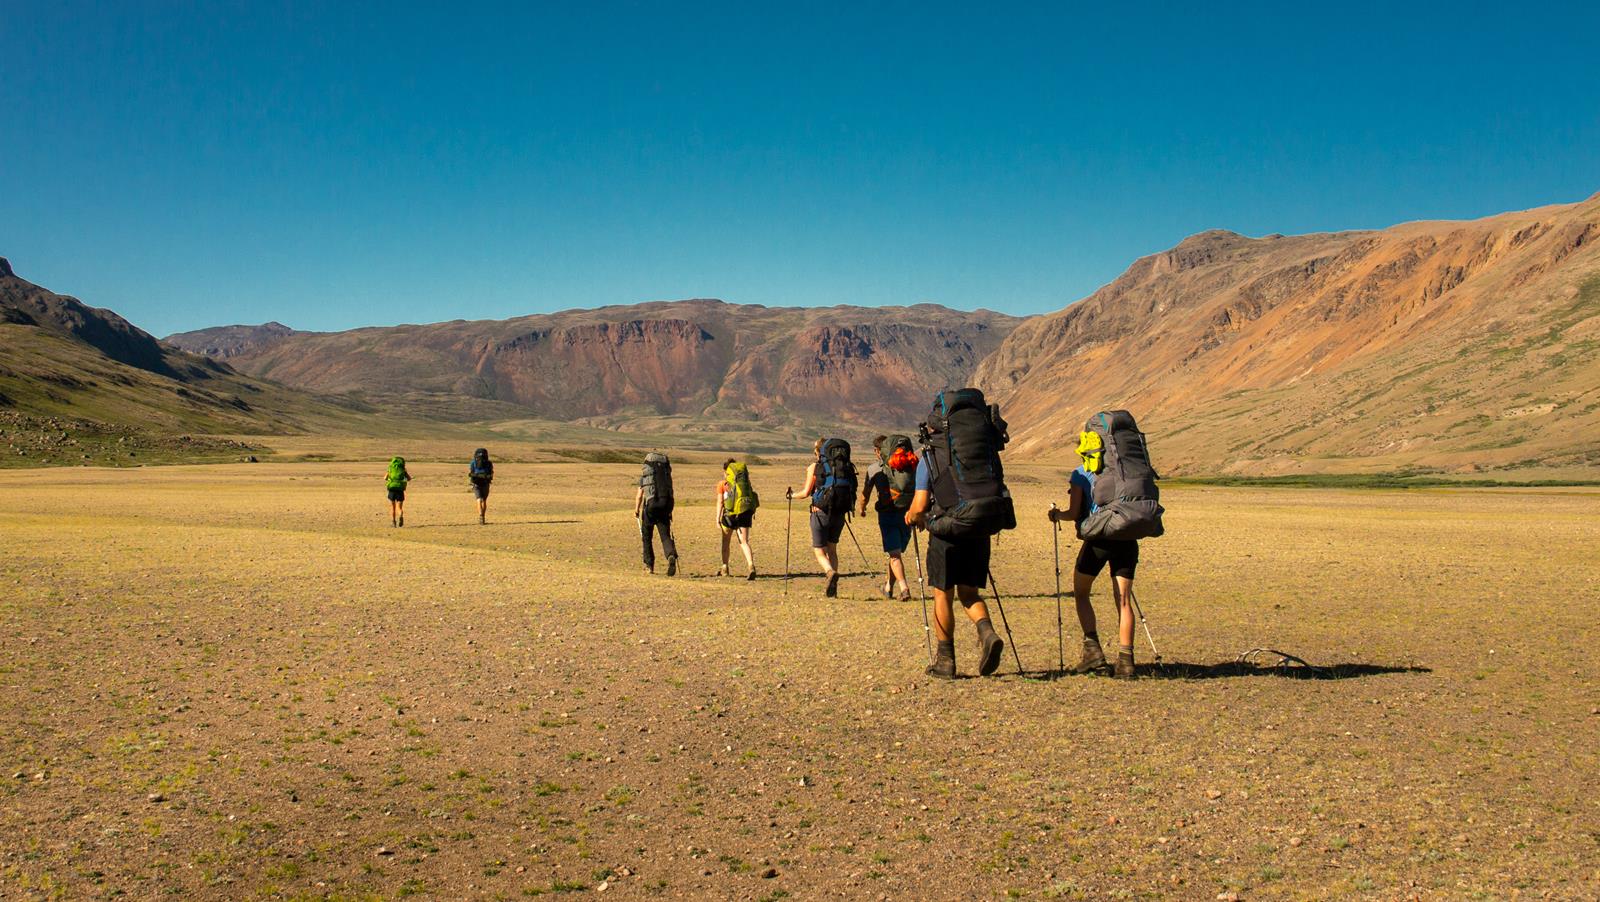
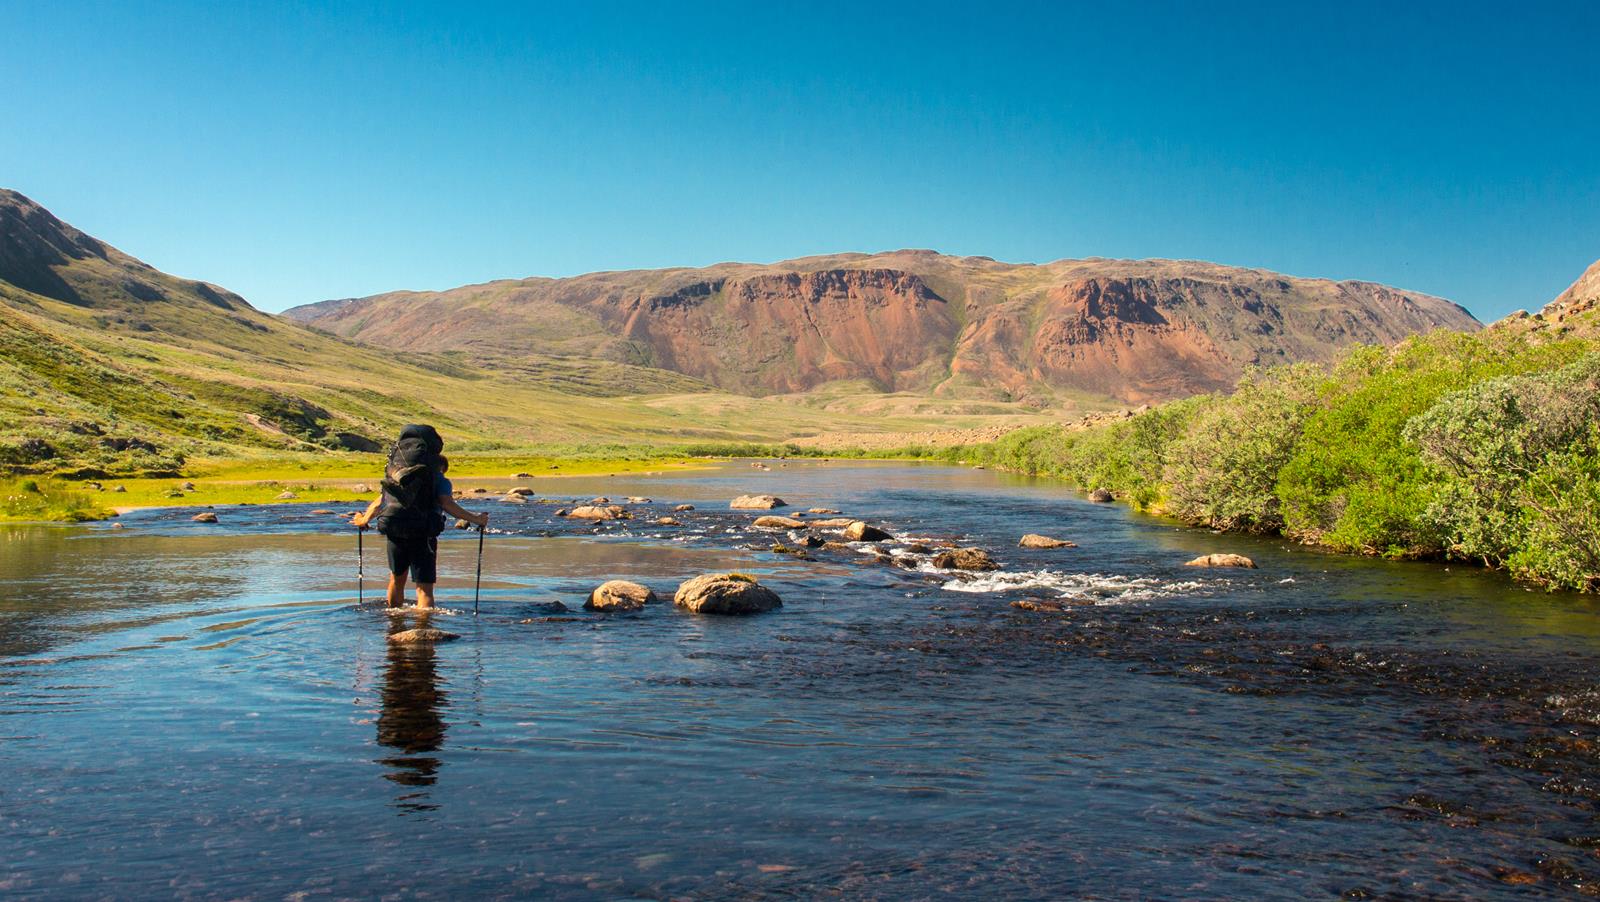
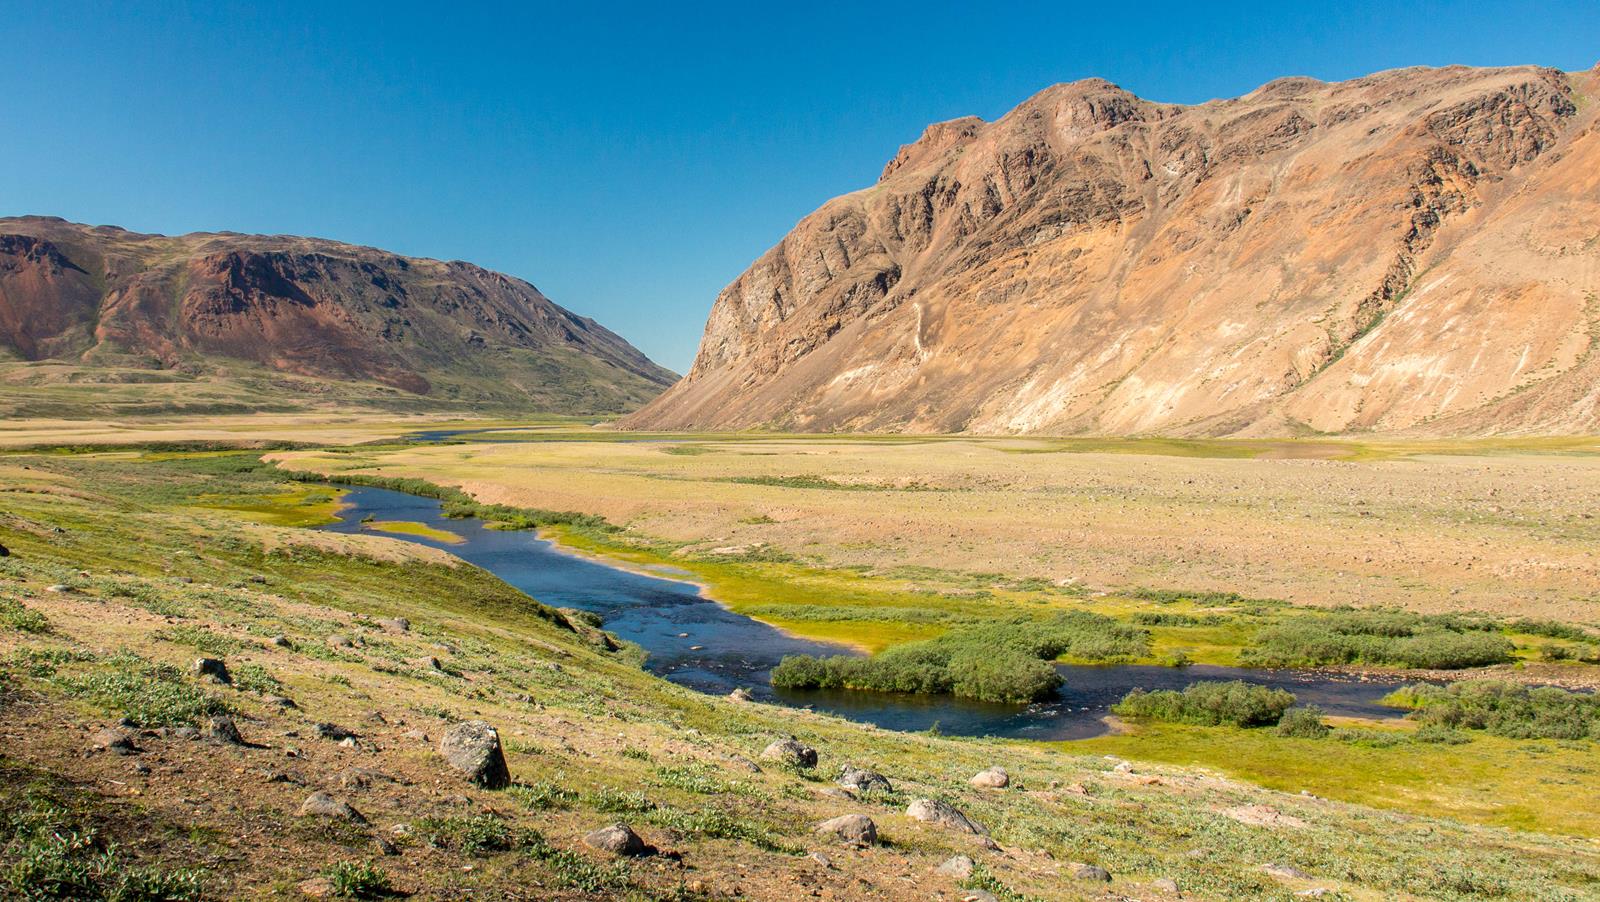
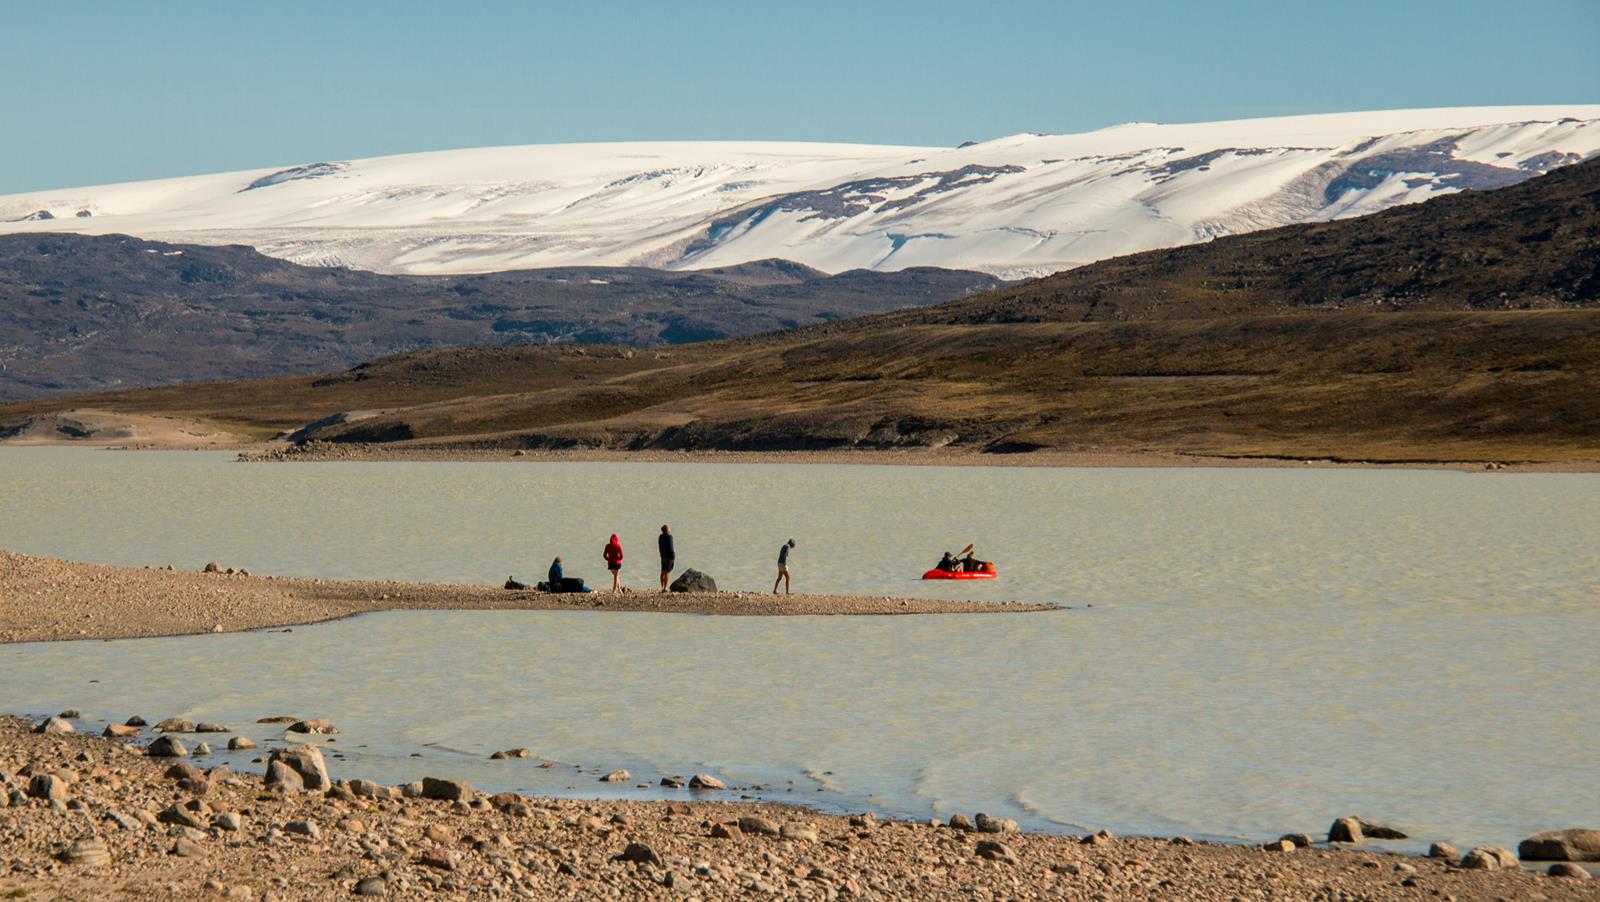
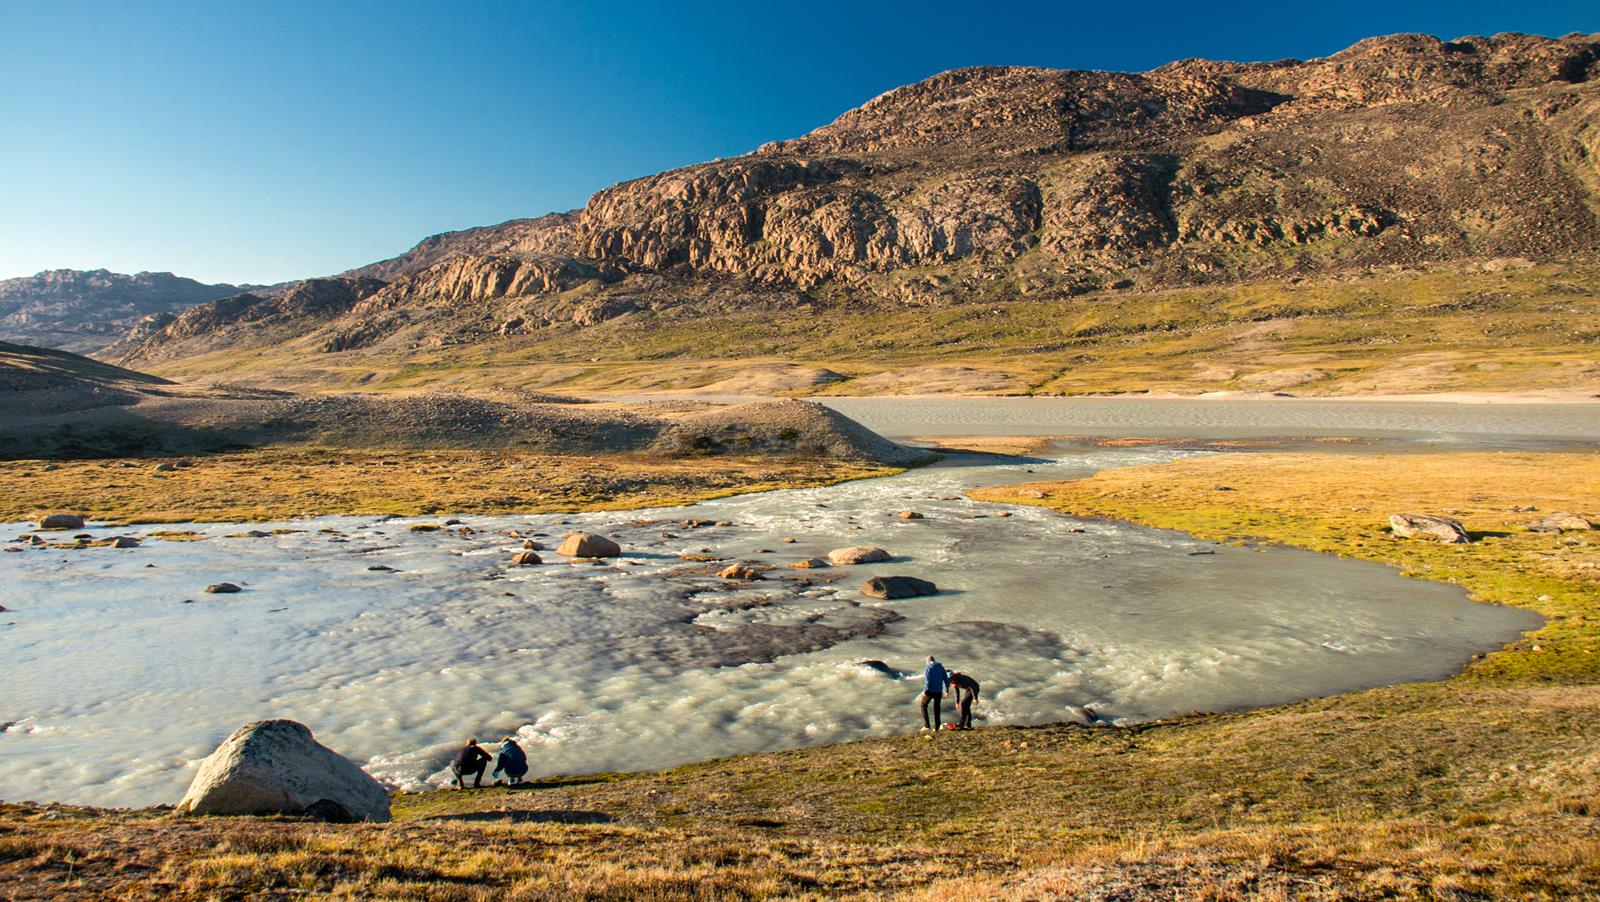
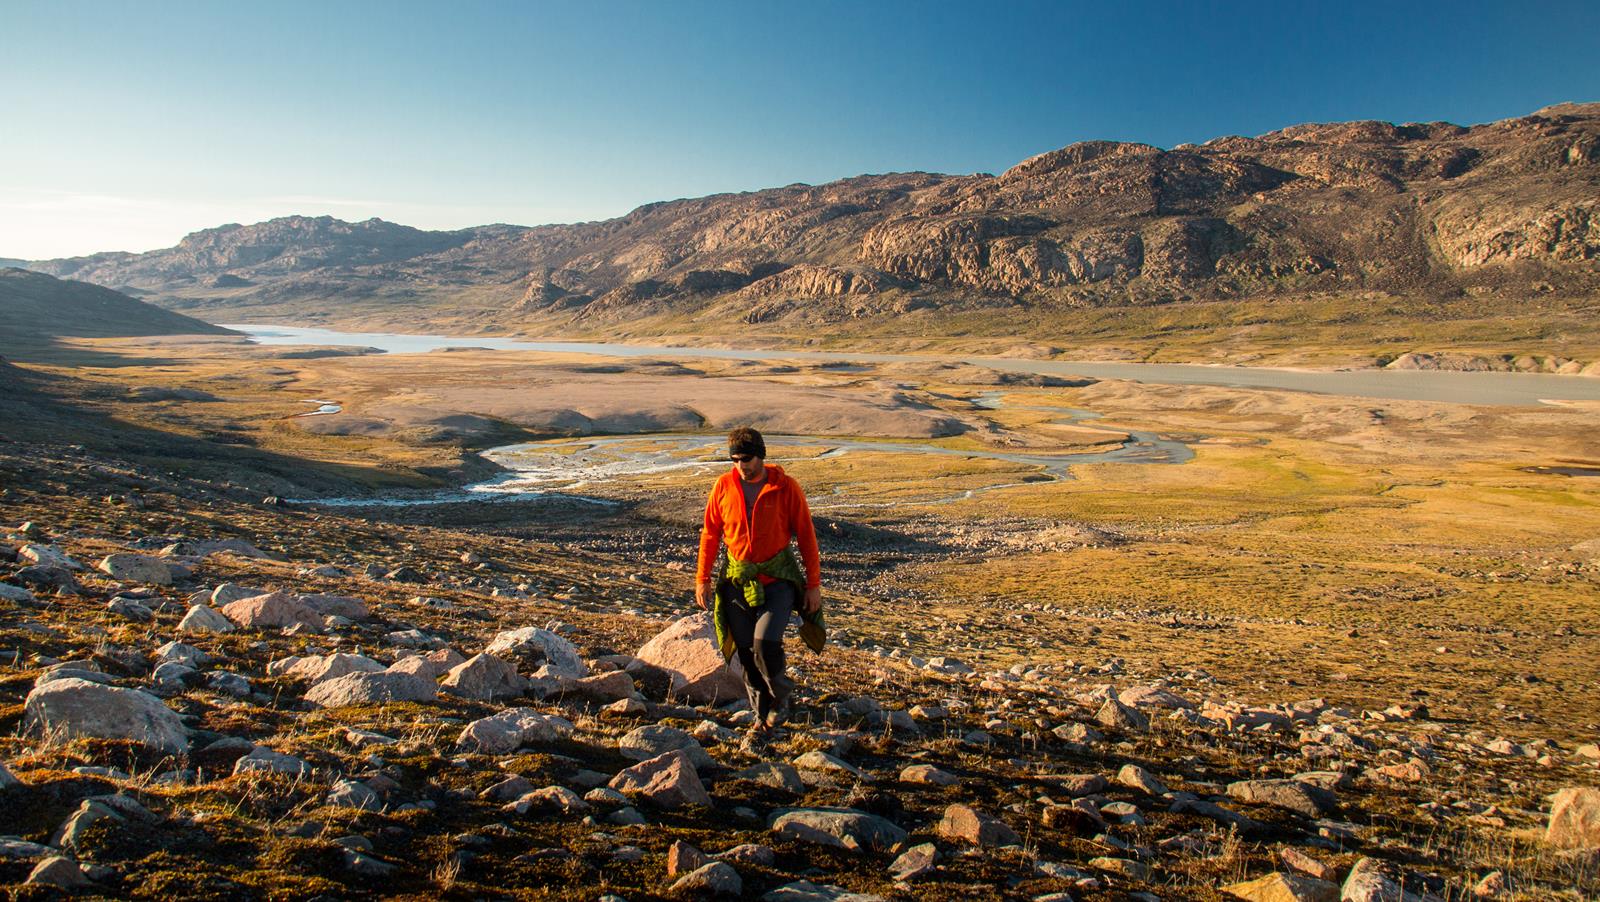
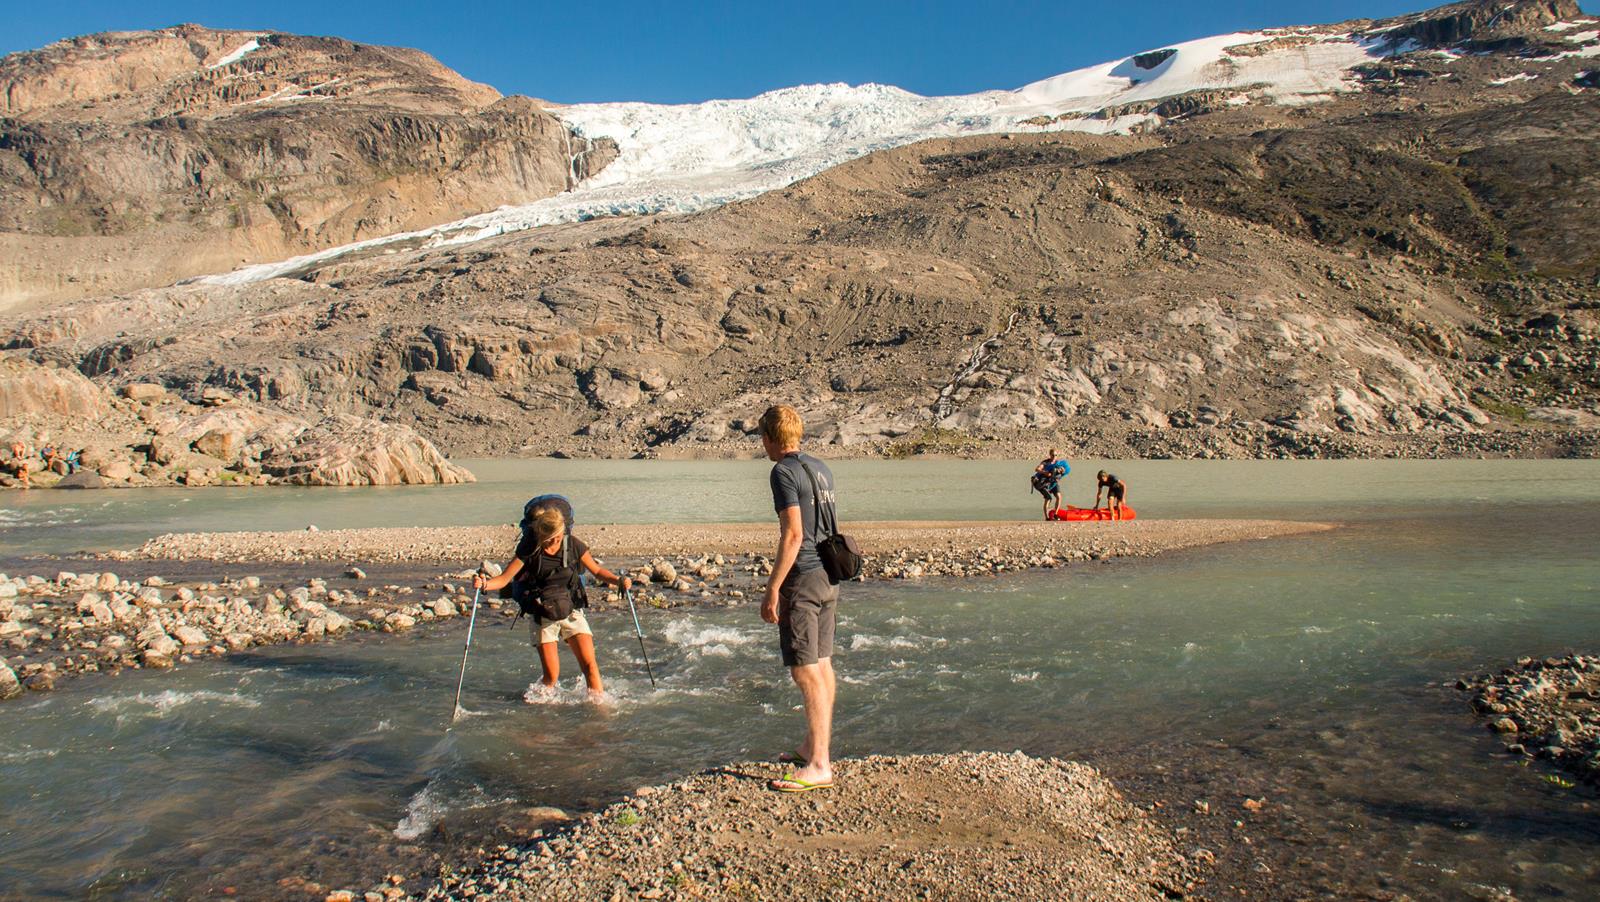
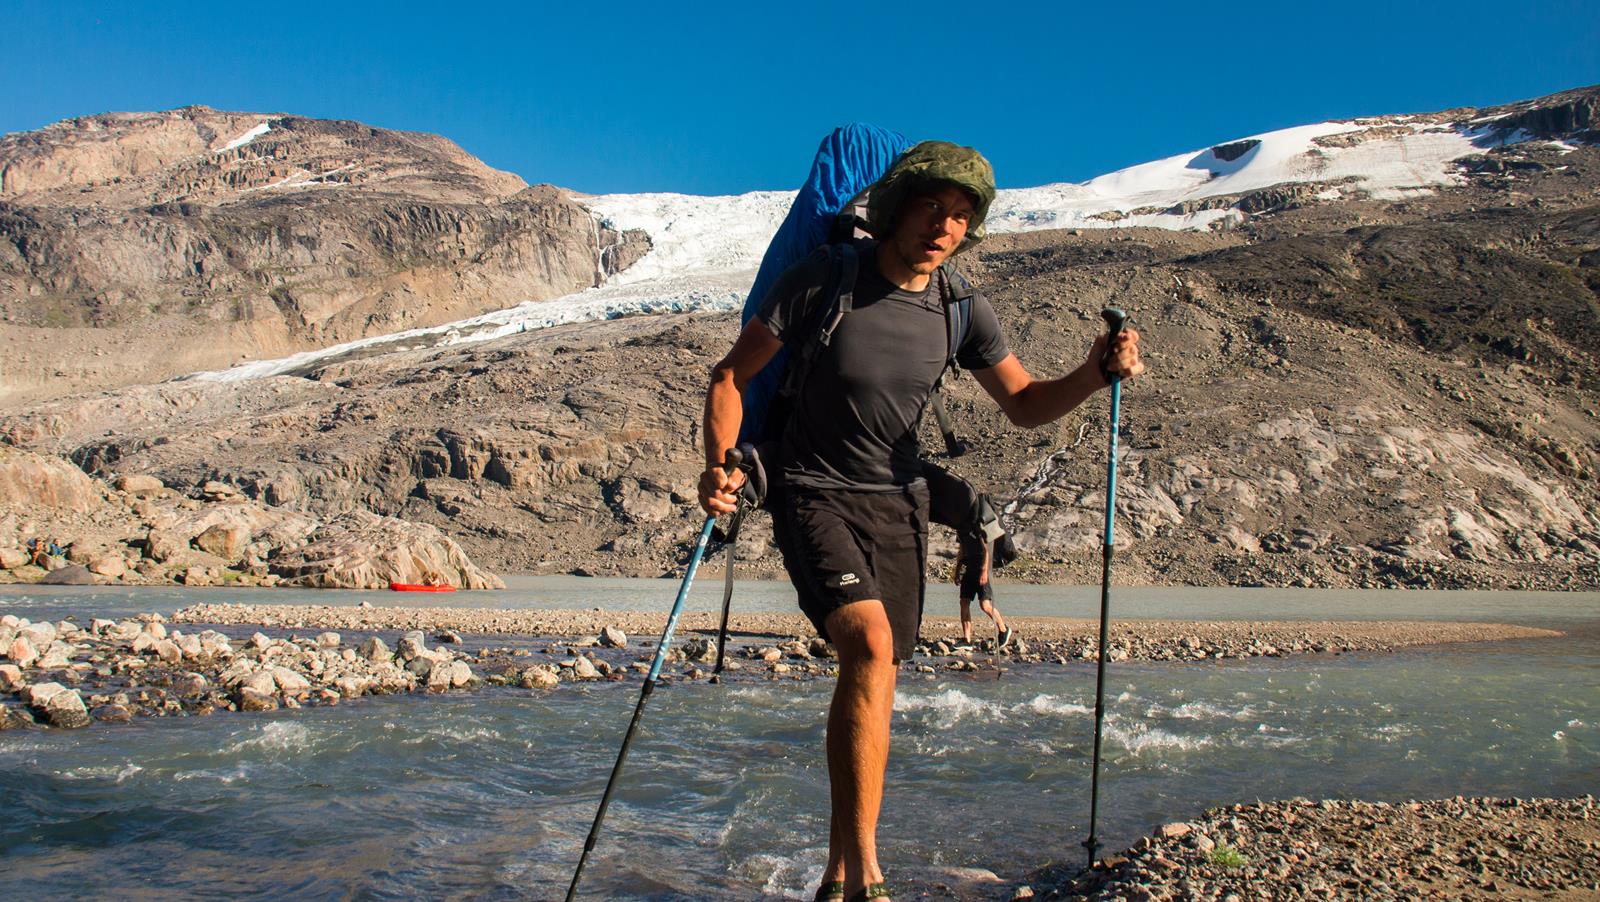
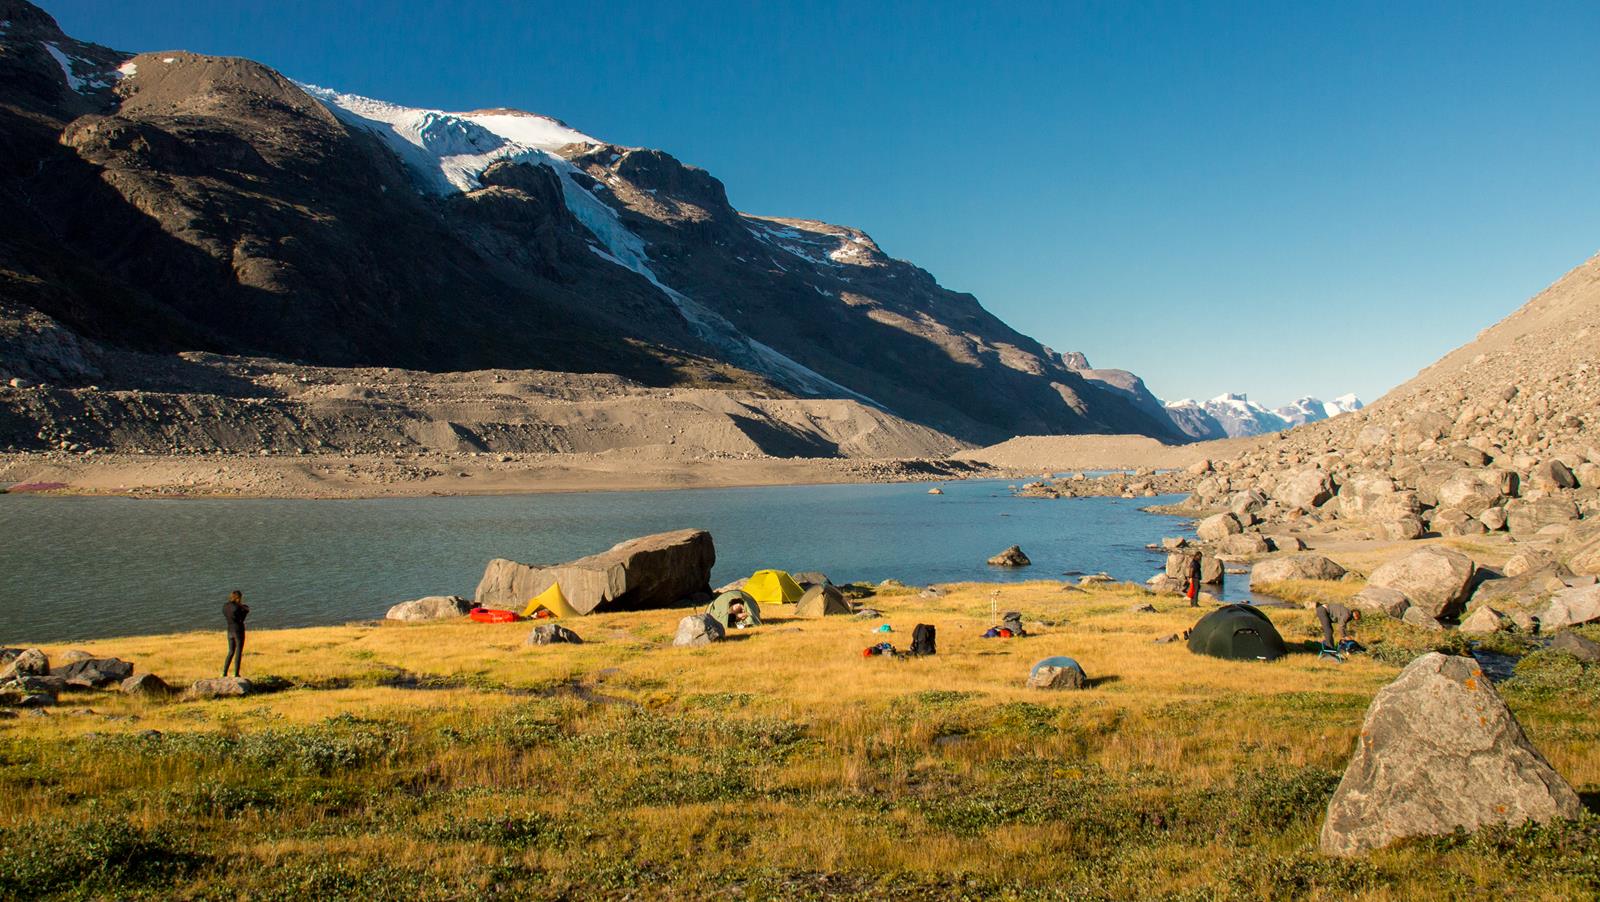
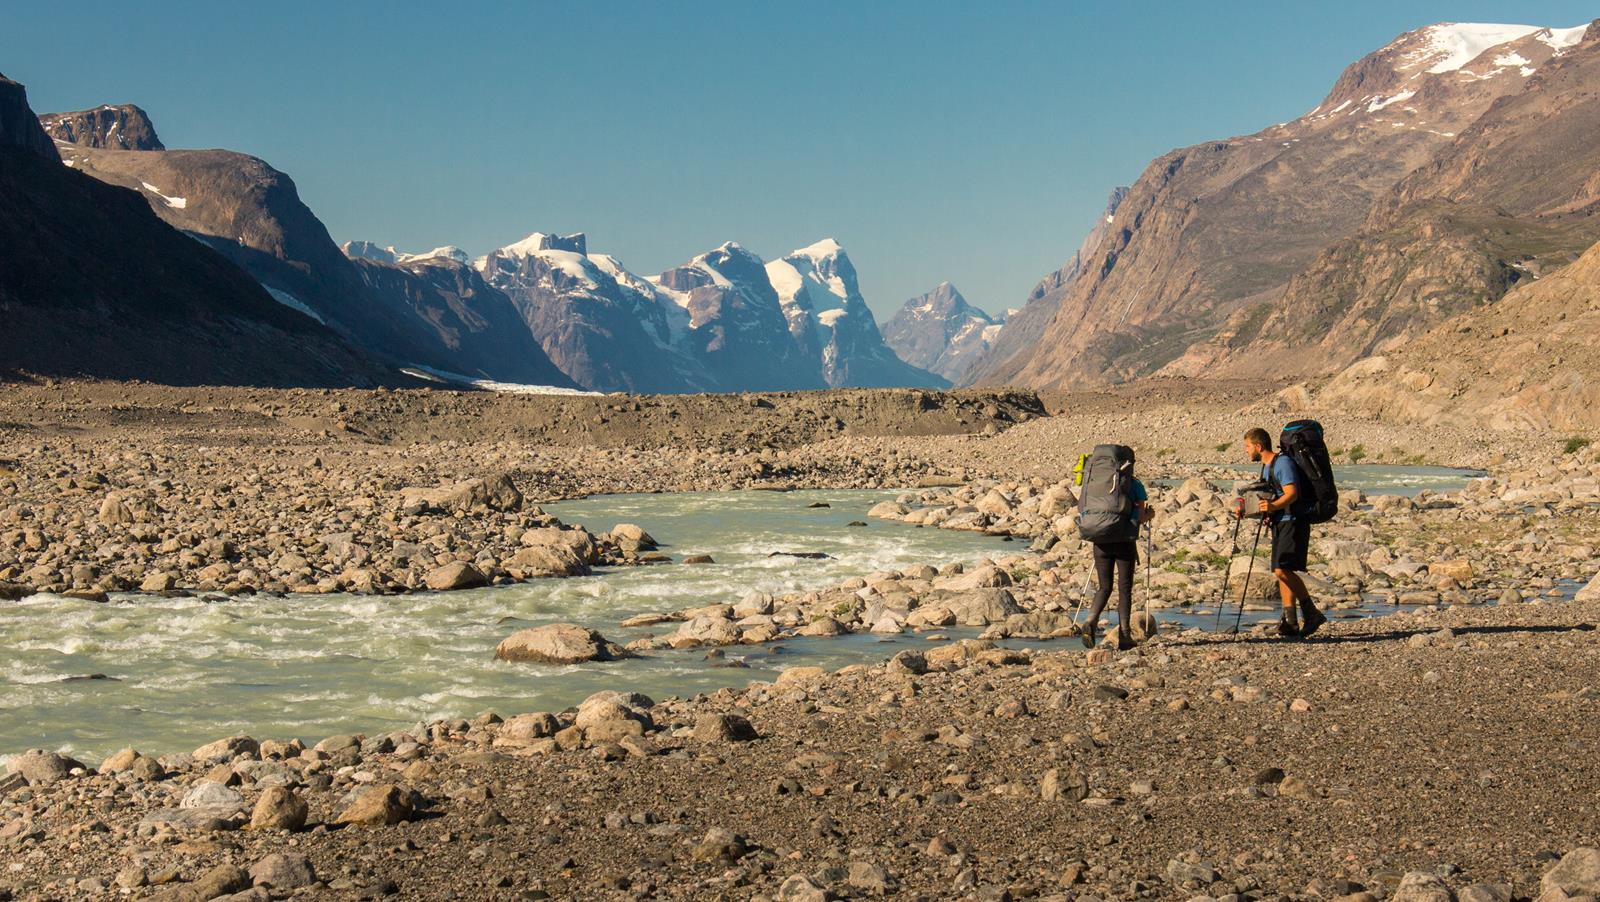
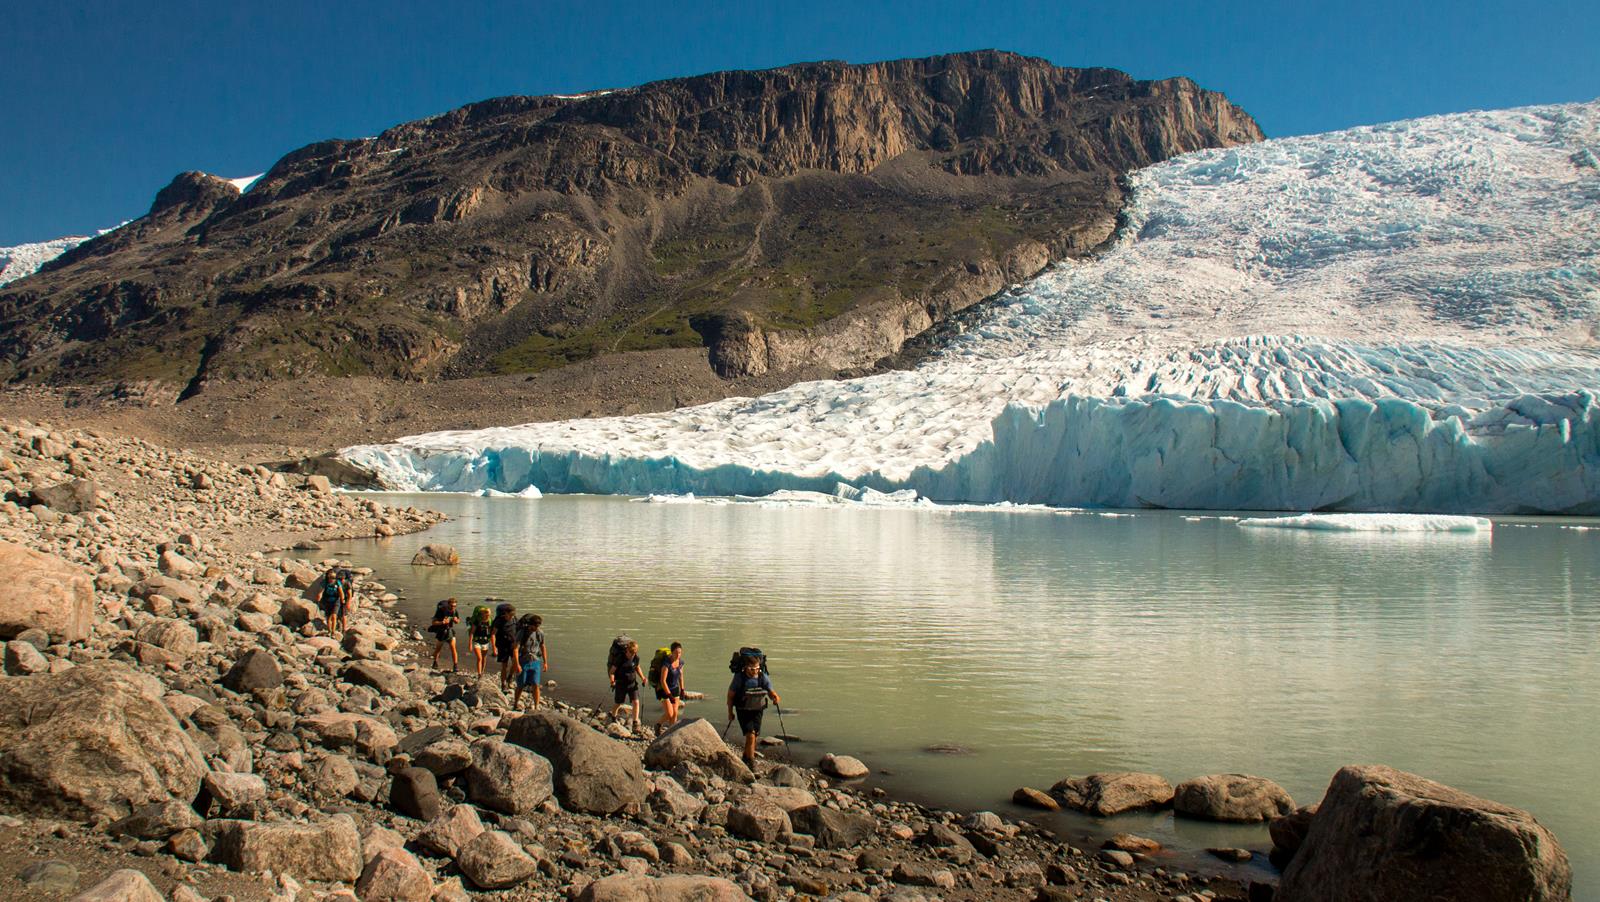
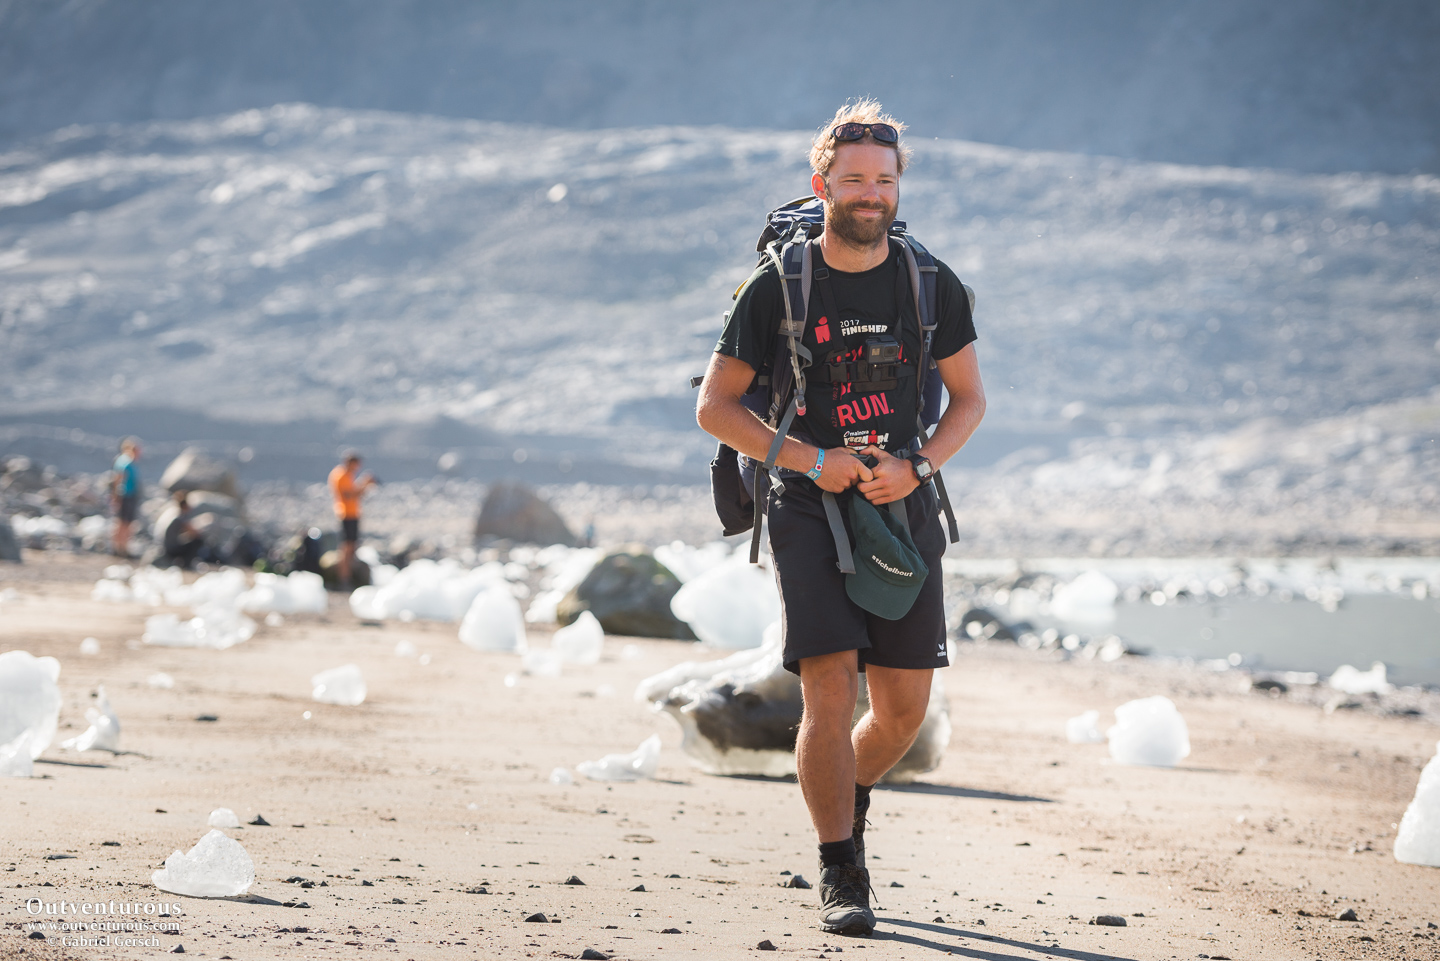
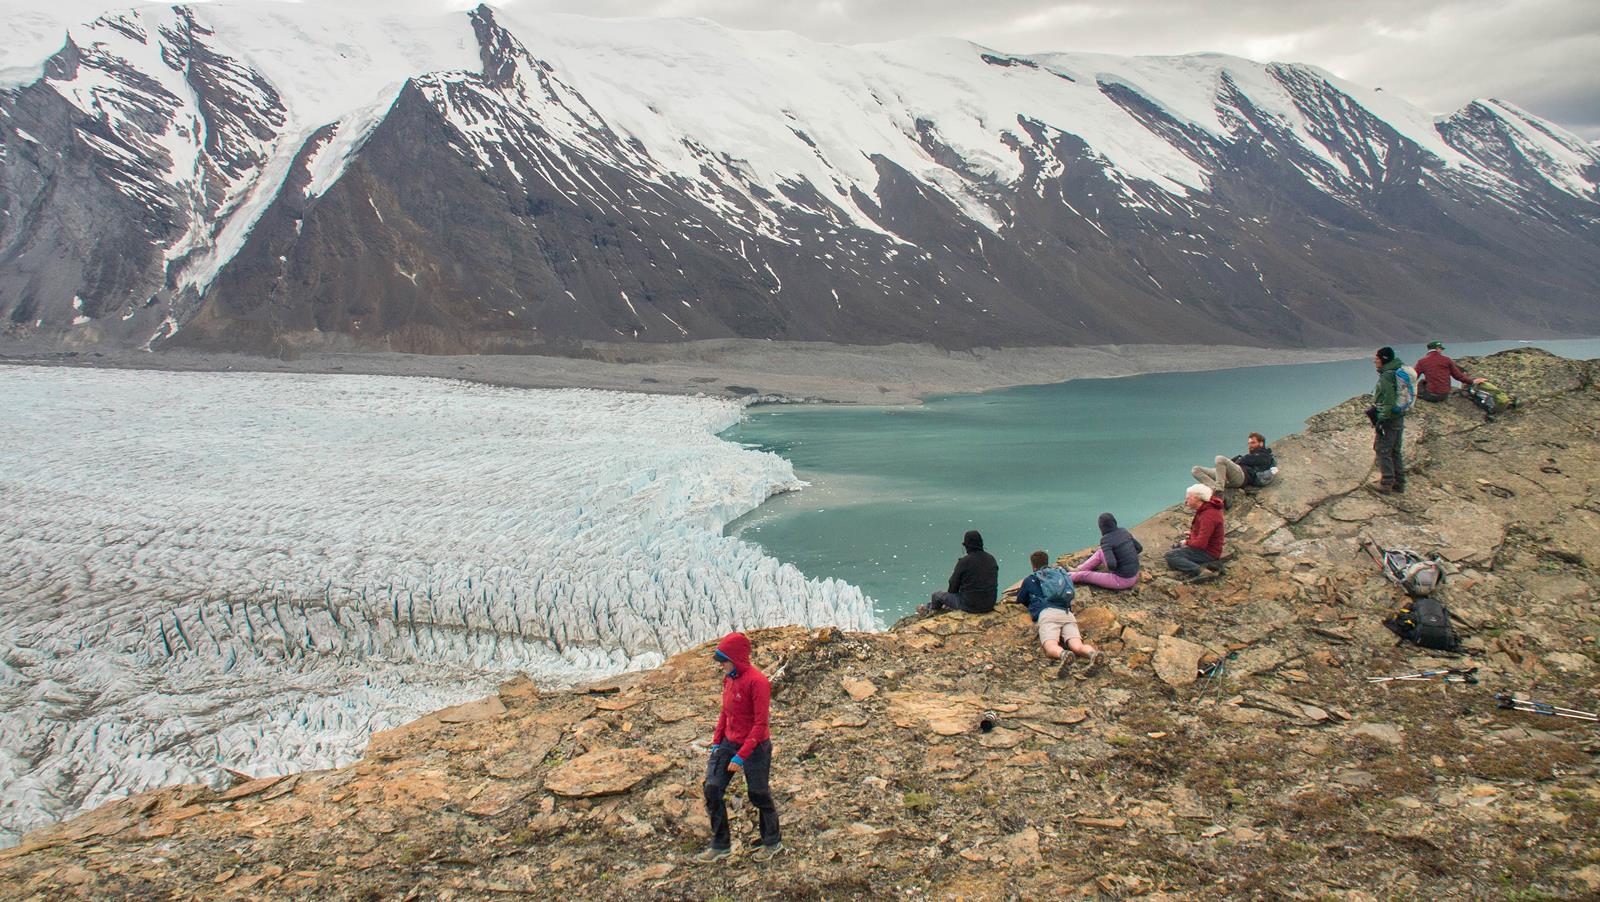
In late july, I disembarked from our sailing yacht and flew south from Ilulissat to Kangerlussuaq to pick up a group of friends for the first long multi-day treks of my summer season – partly based on my own Greenland adventure in 2016. We first spent a few days at the fringes of the massive ice sheet, and then started a wonderful 8-day trek from Robinson River all the way to the tip of Eternity Fjord, roaming through Greenland’s largest muskoxen herds along the way.
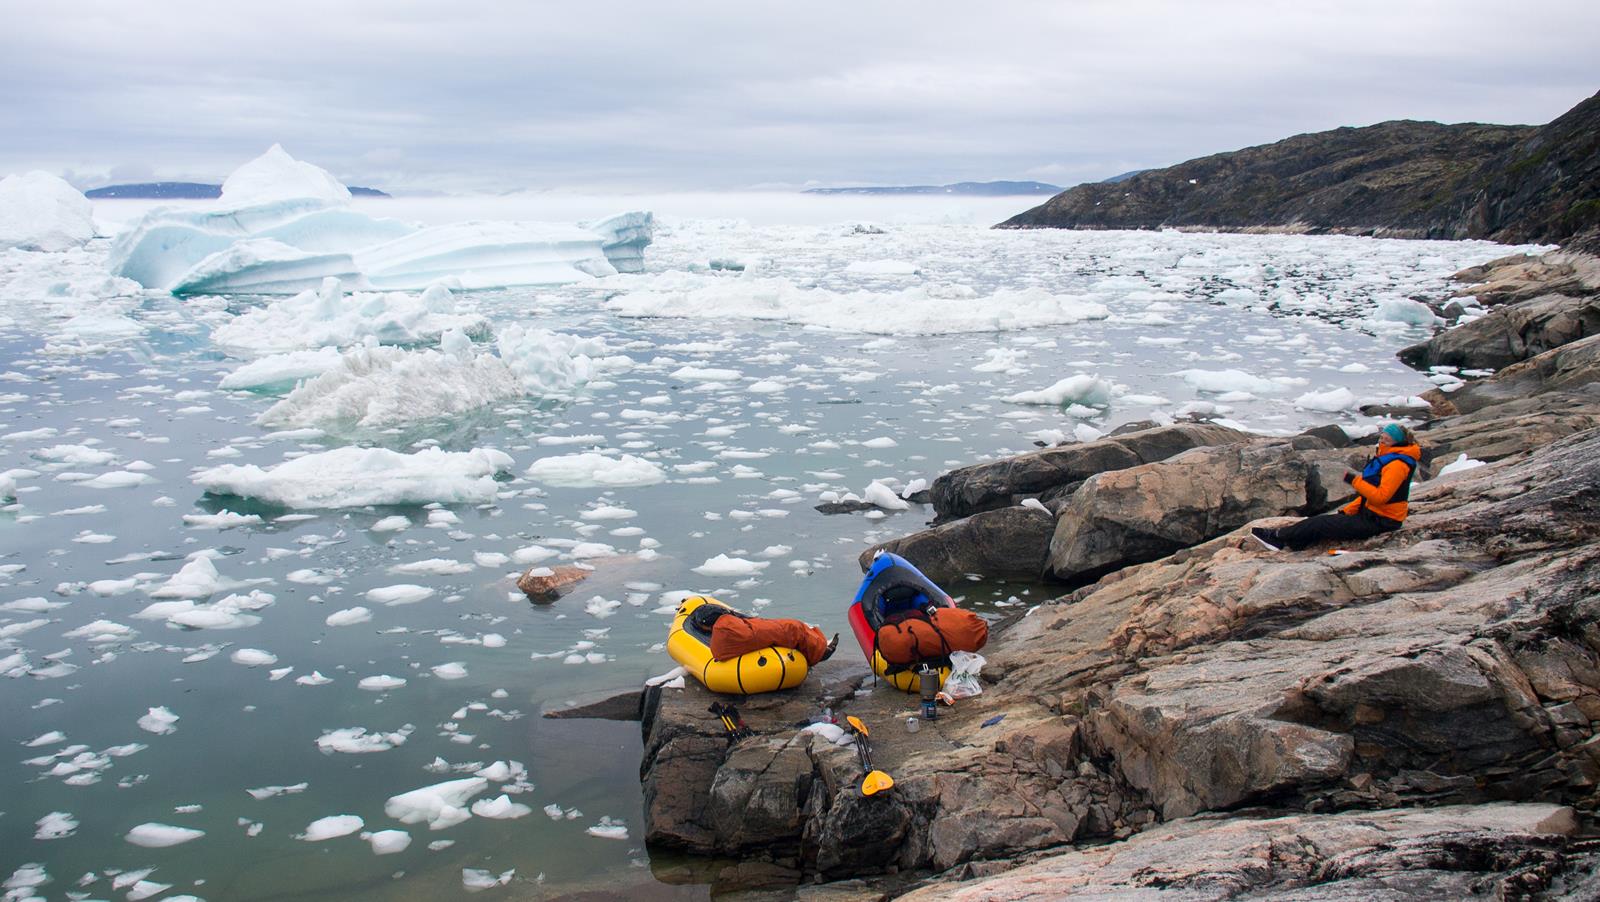
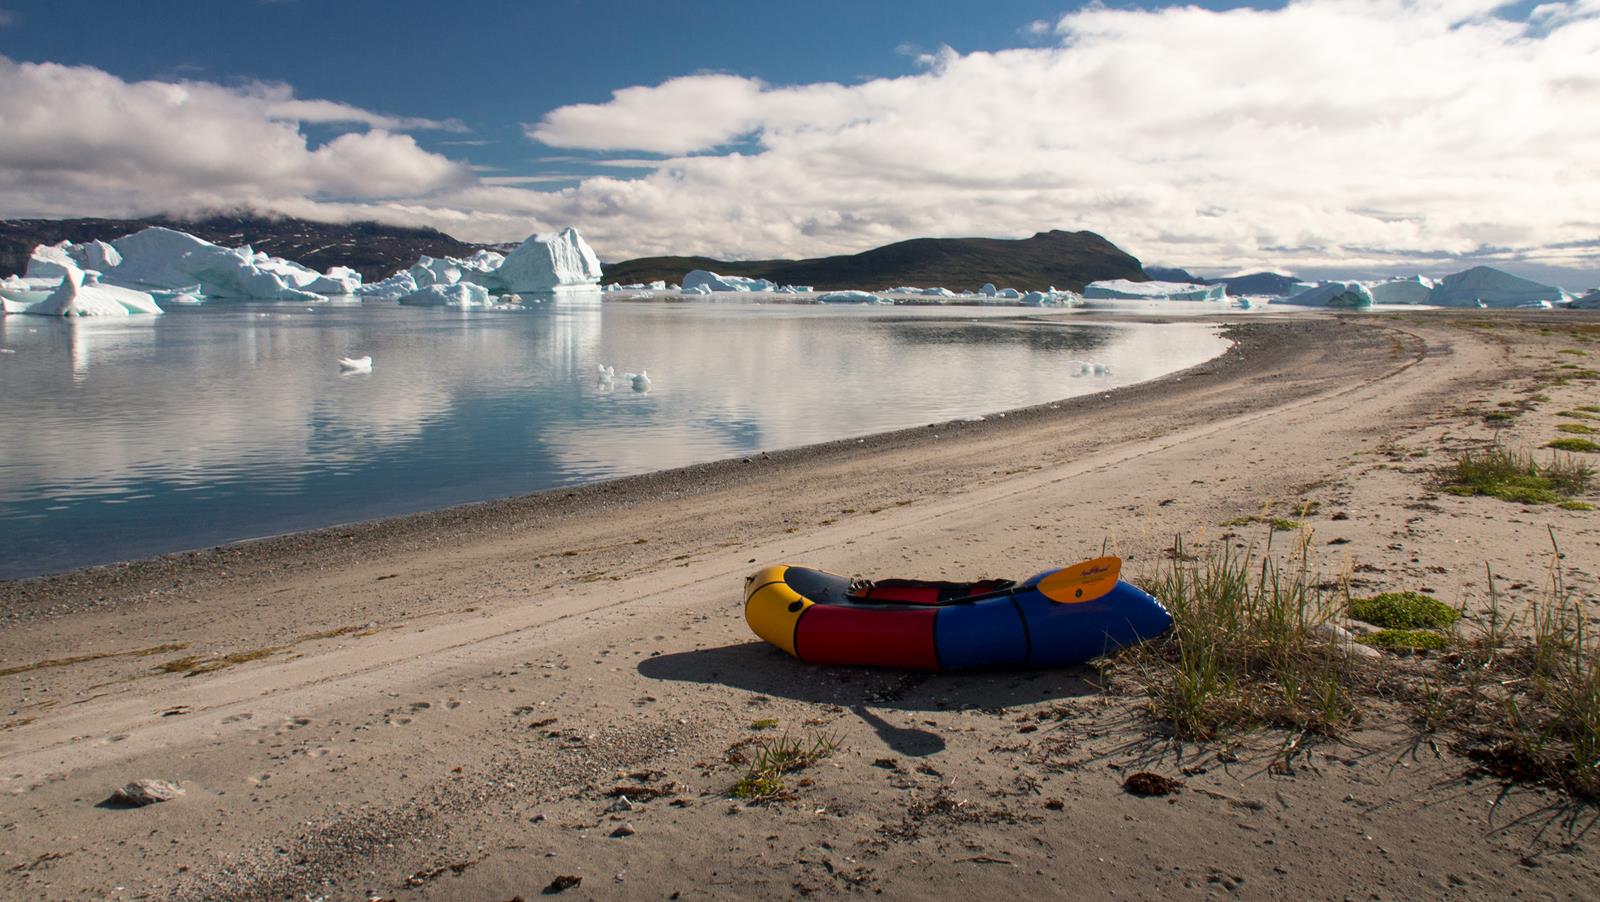
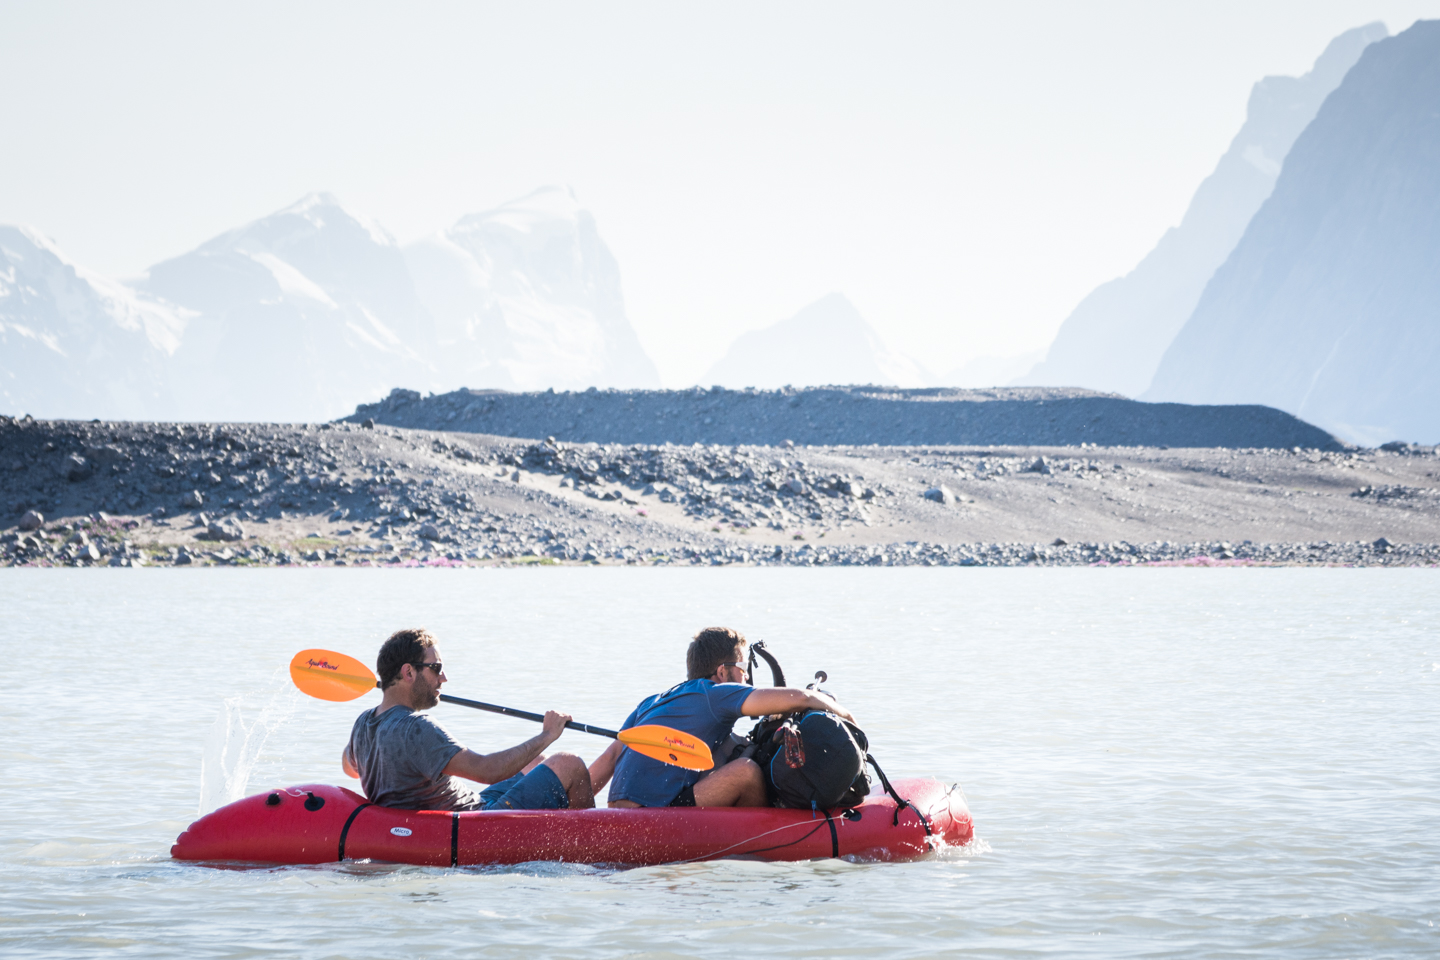
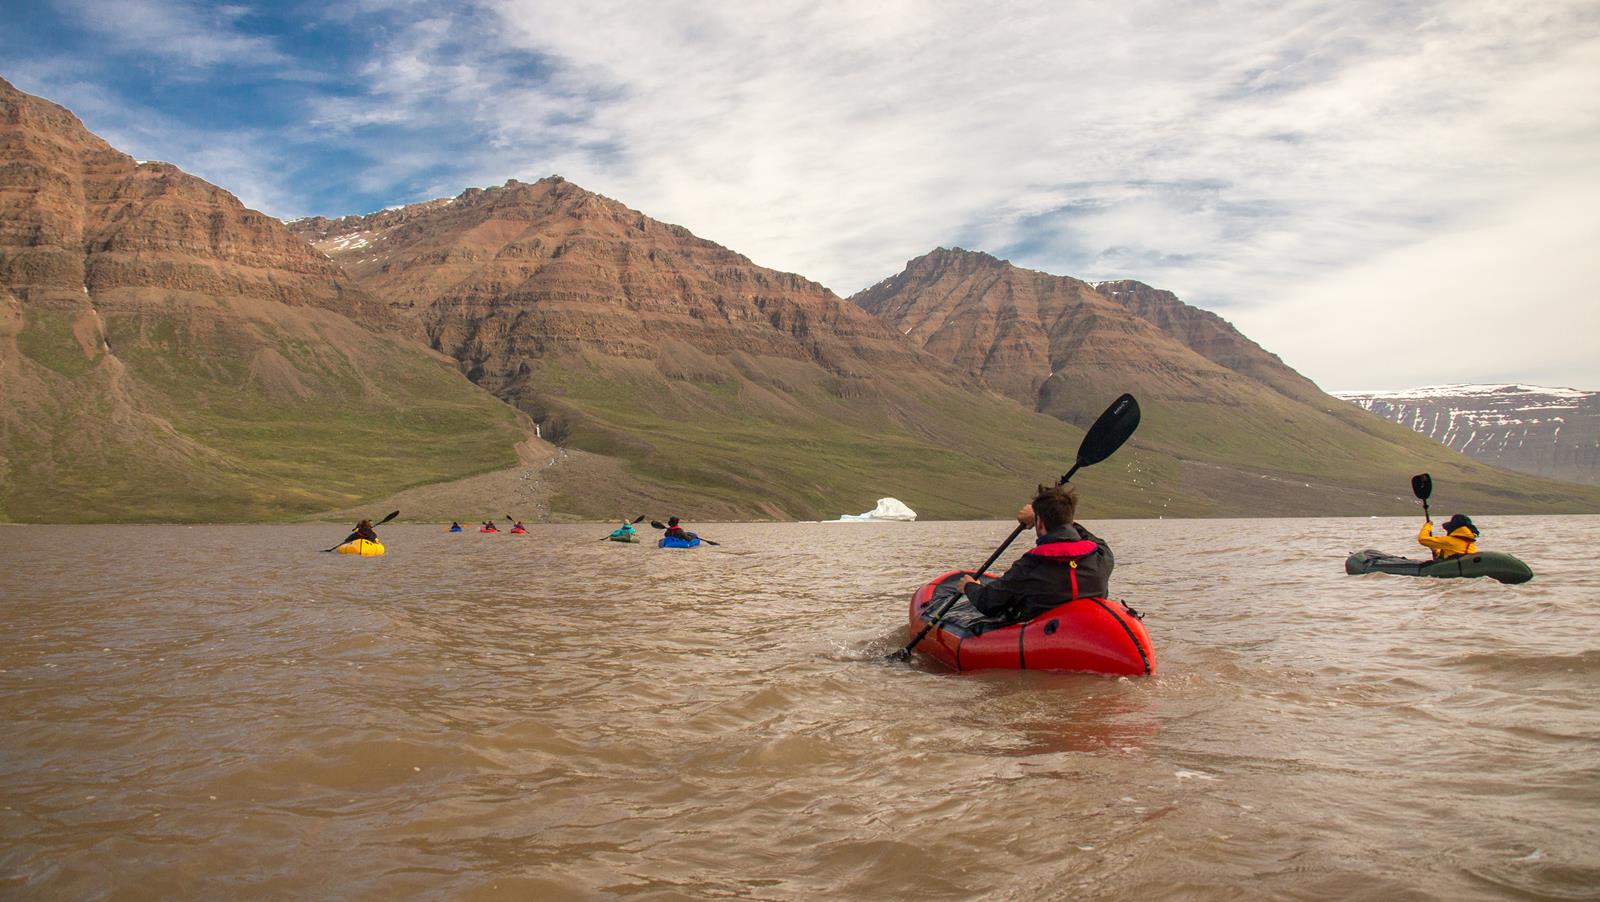
I carried a 2-person packraft so we could cross liquid barriers such as large meltwater rivers and lakes along the way – allowing a unique trajectory which would otherwise have been impossible, without everybody having to carry his own raft (and 4kg of extra gear). The entire trip was blessed with incredible weather: almost no clouds and temperatures of 20-25 degrees every single day.
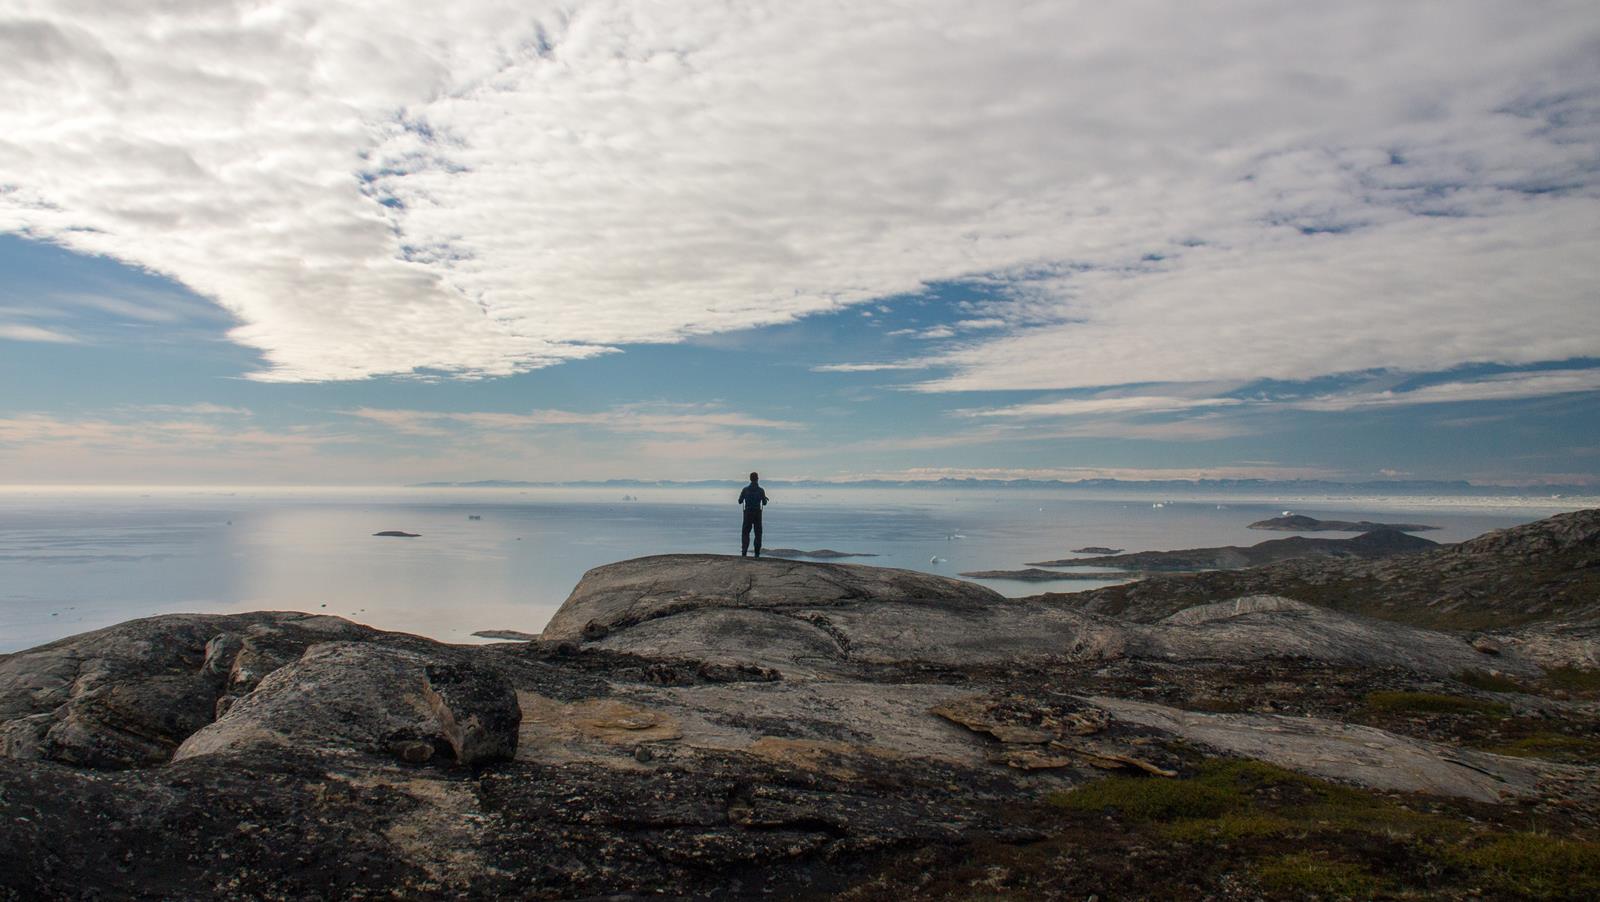
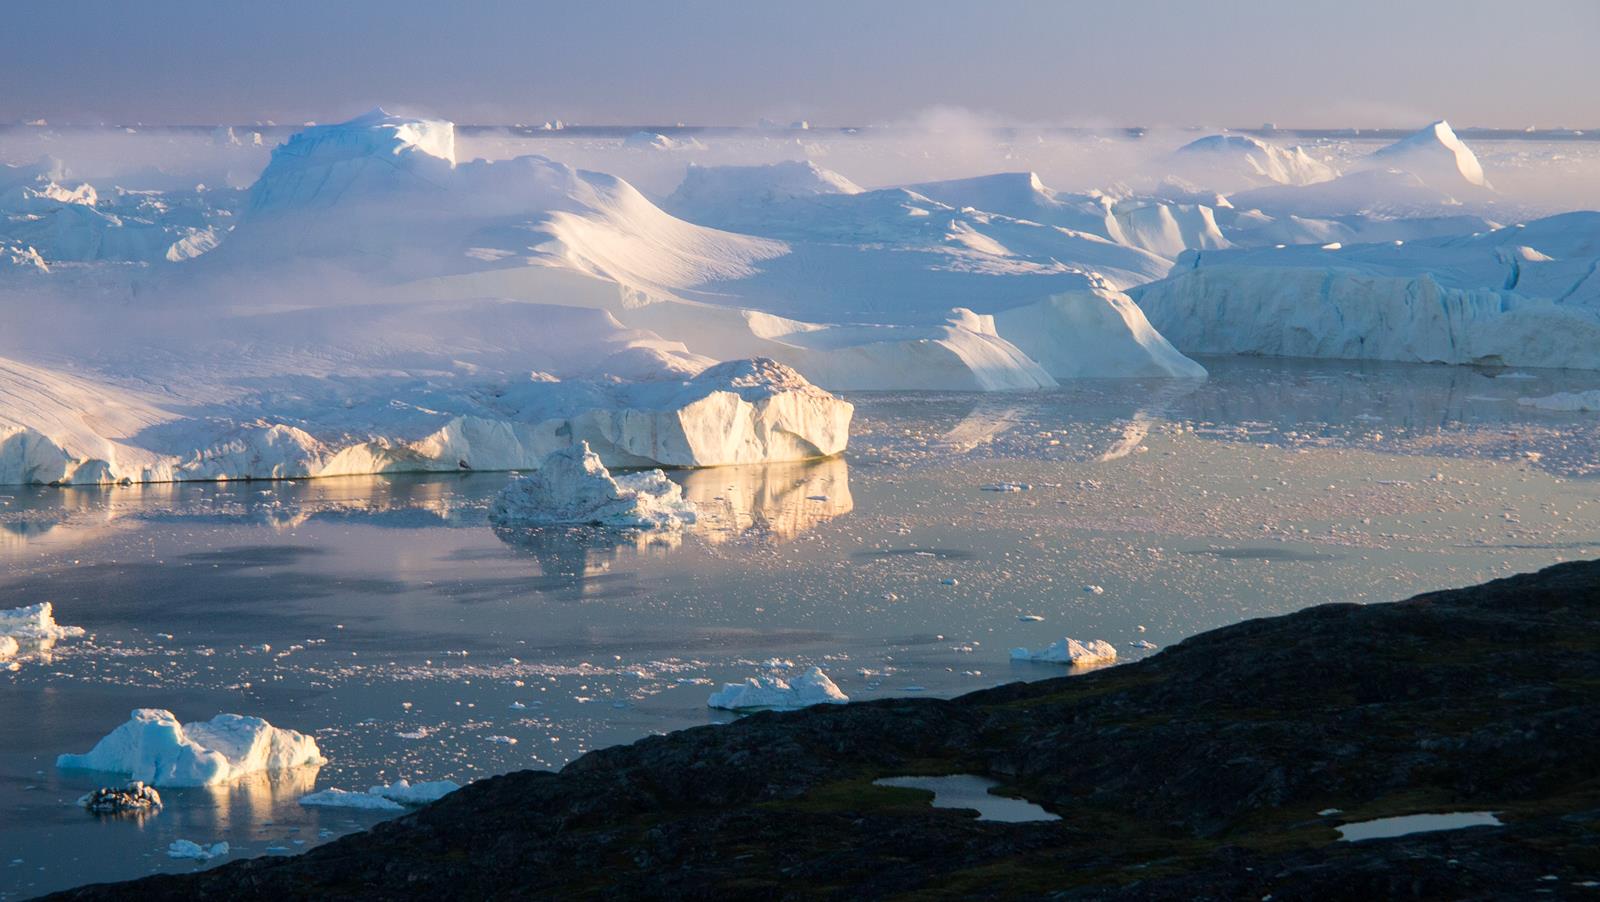
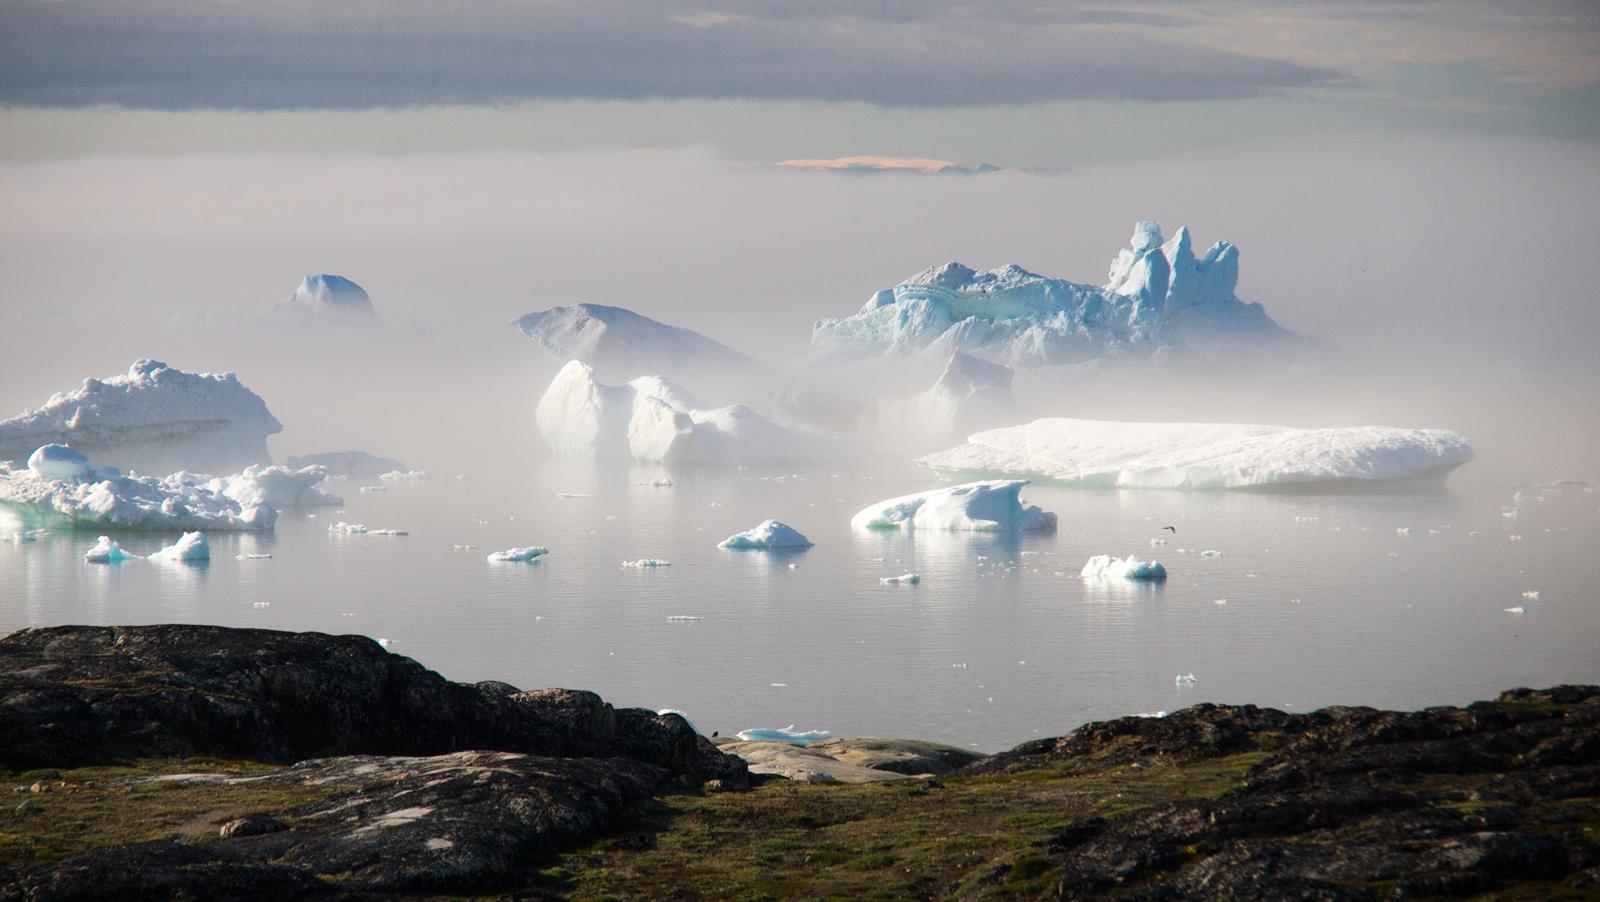
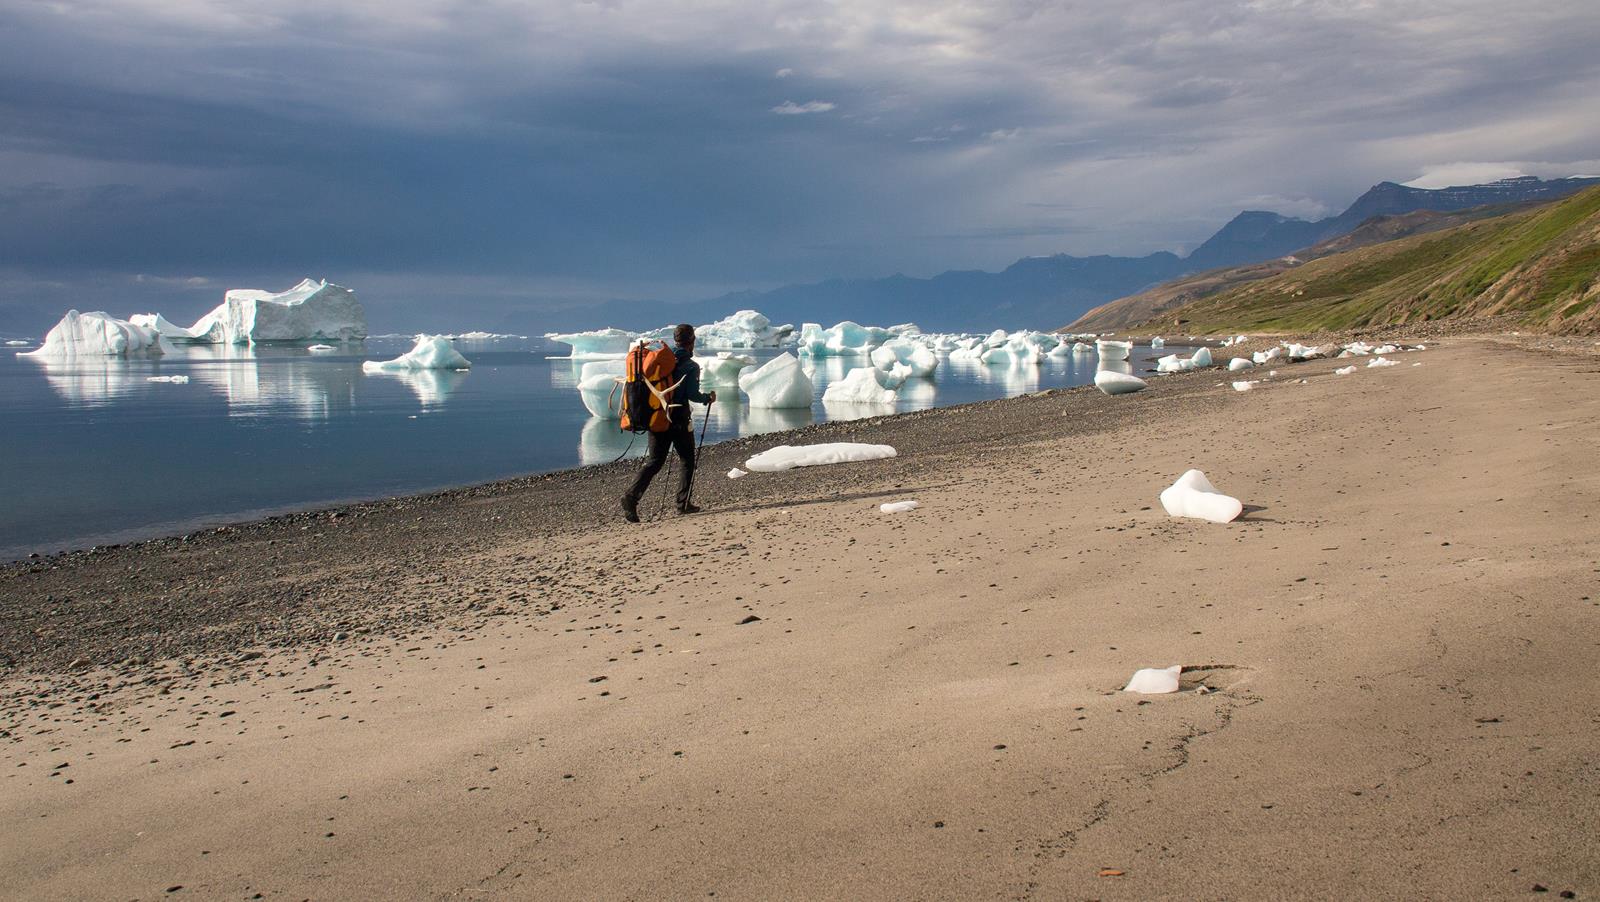
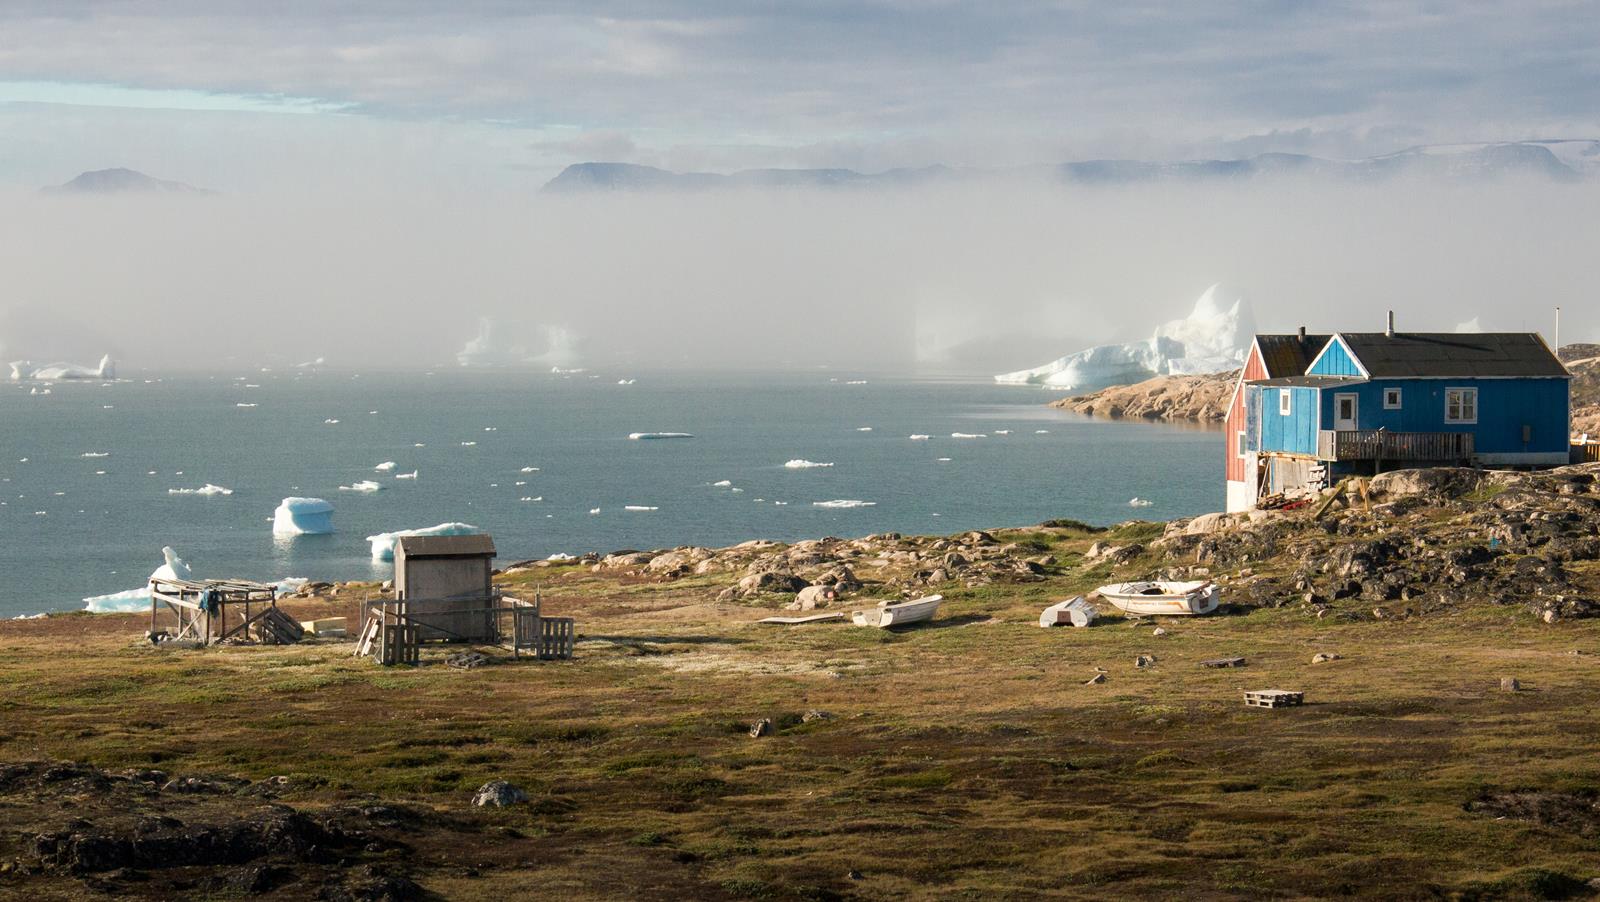
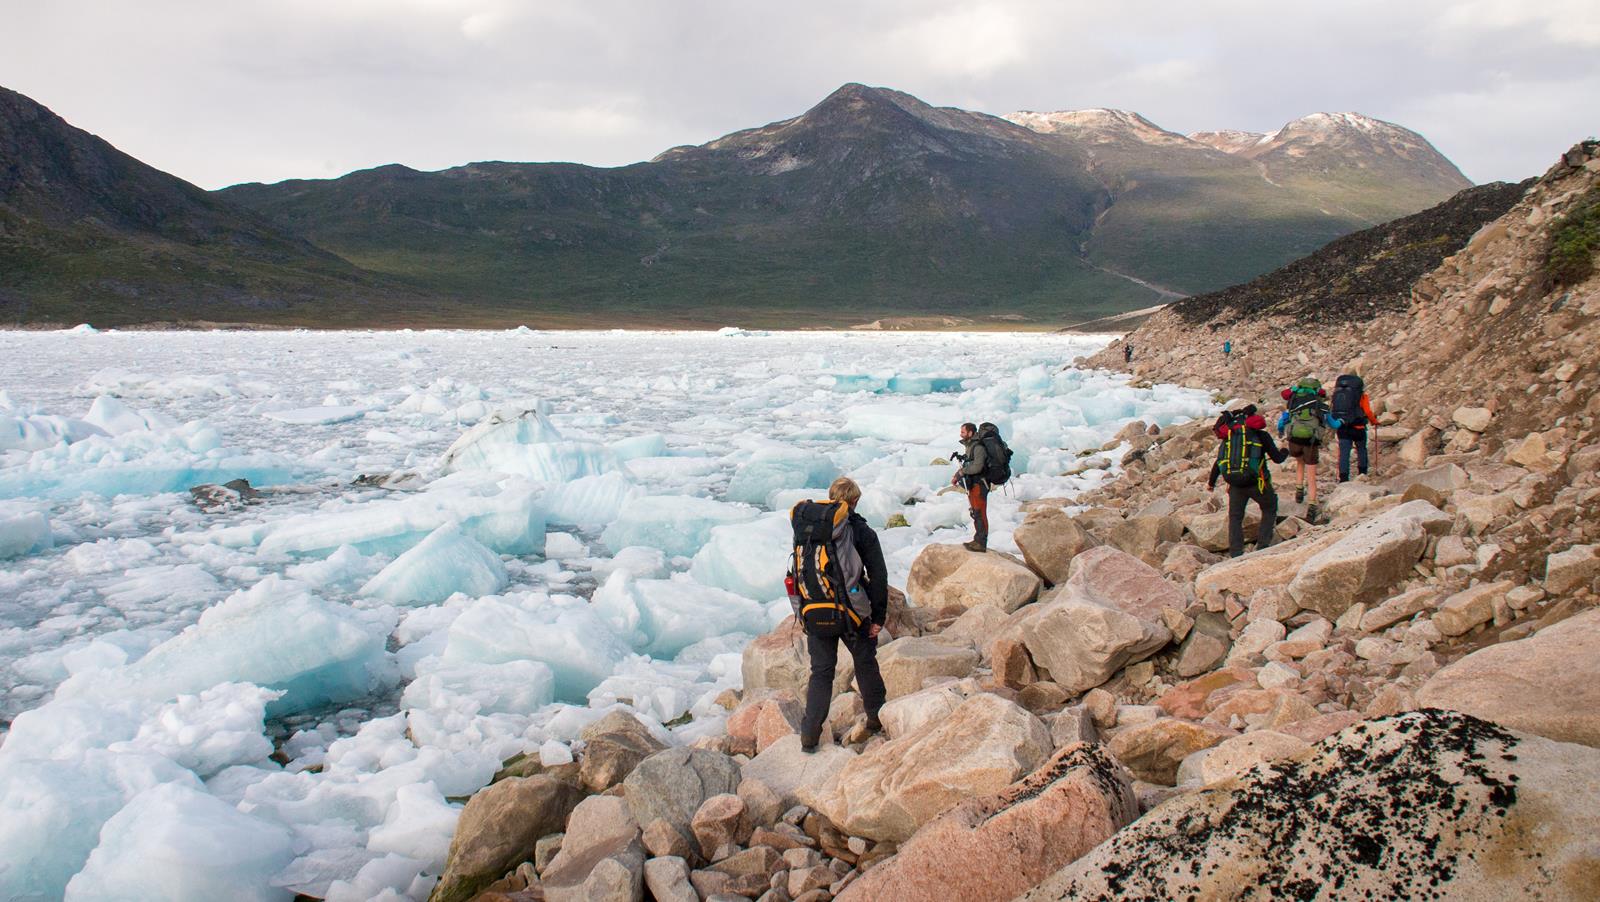
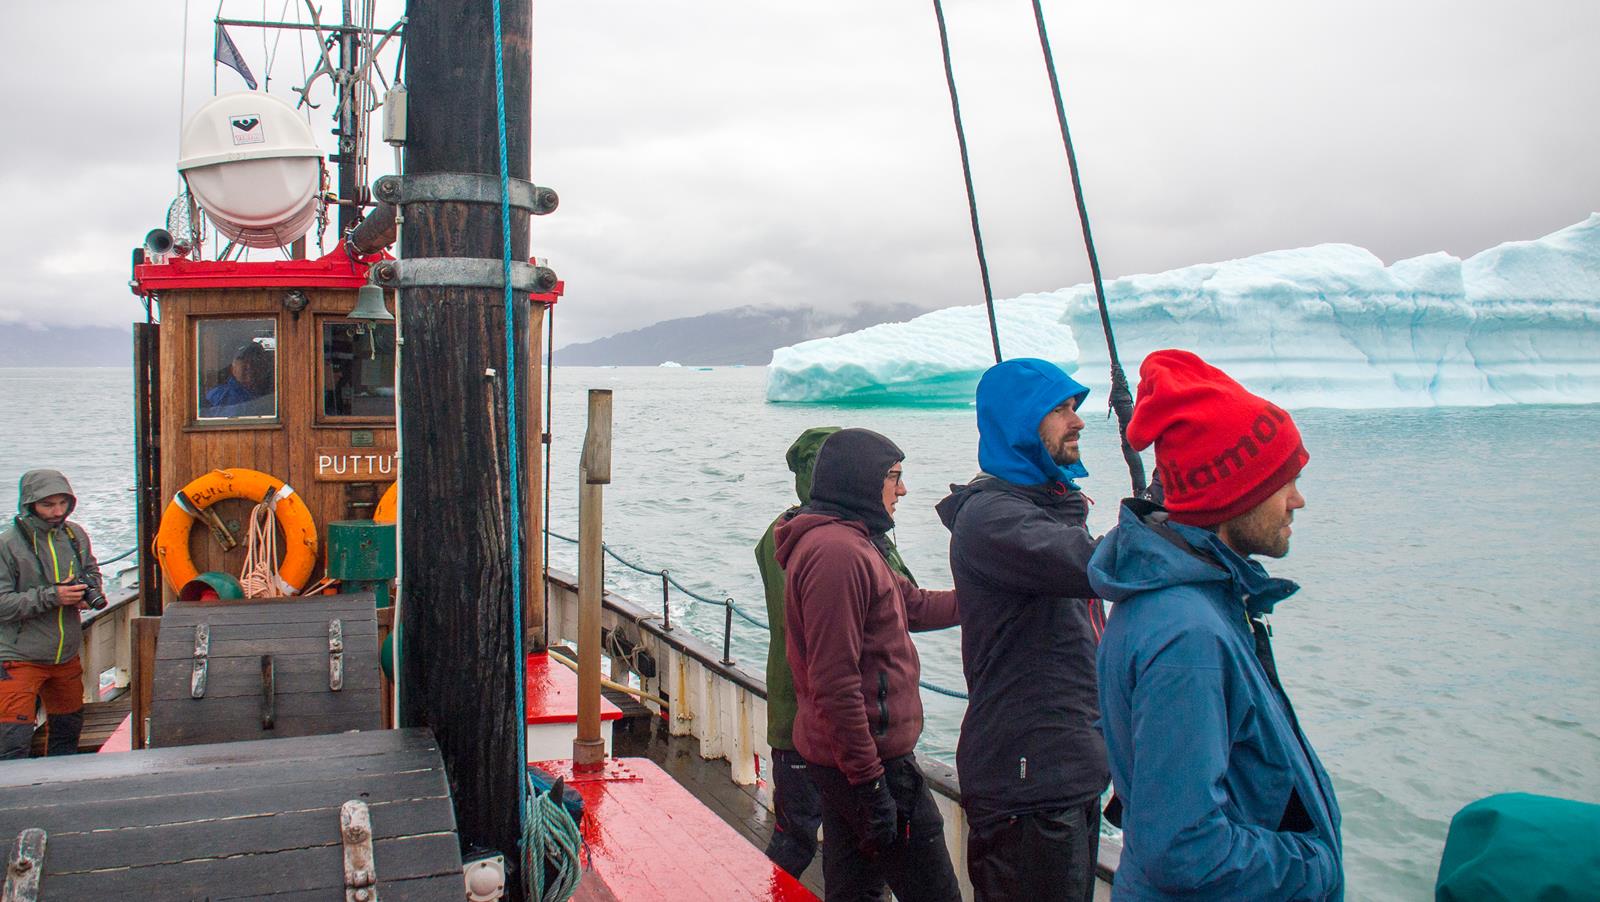
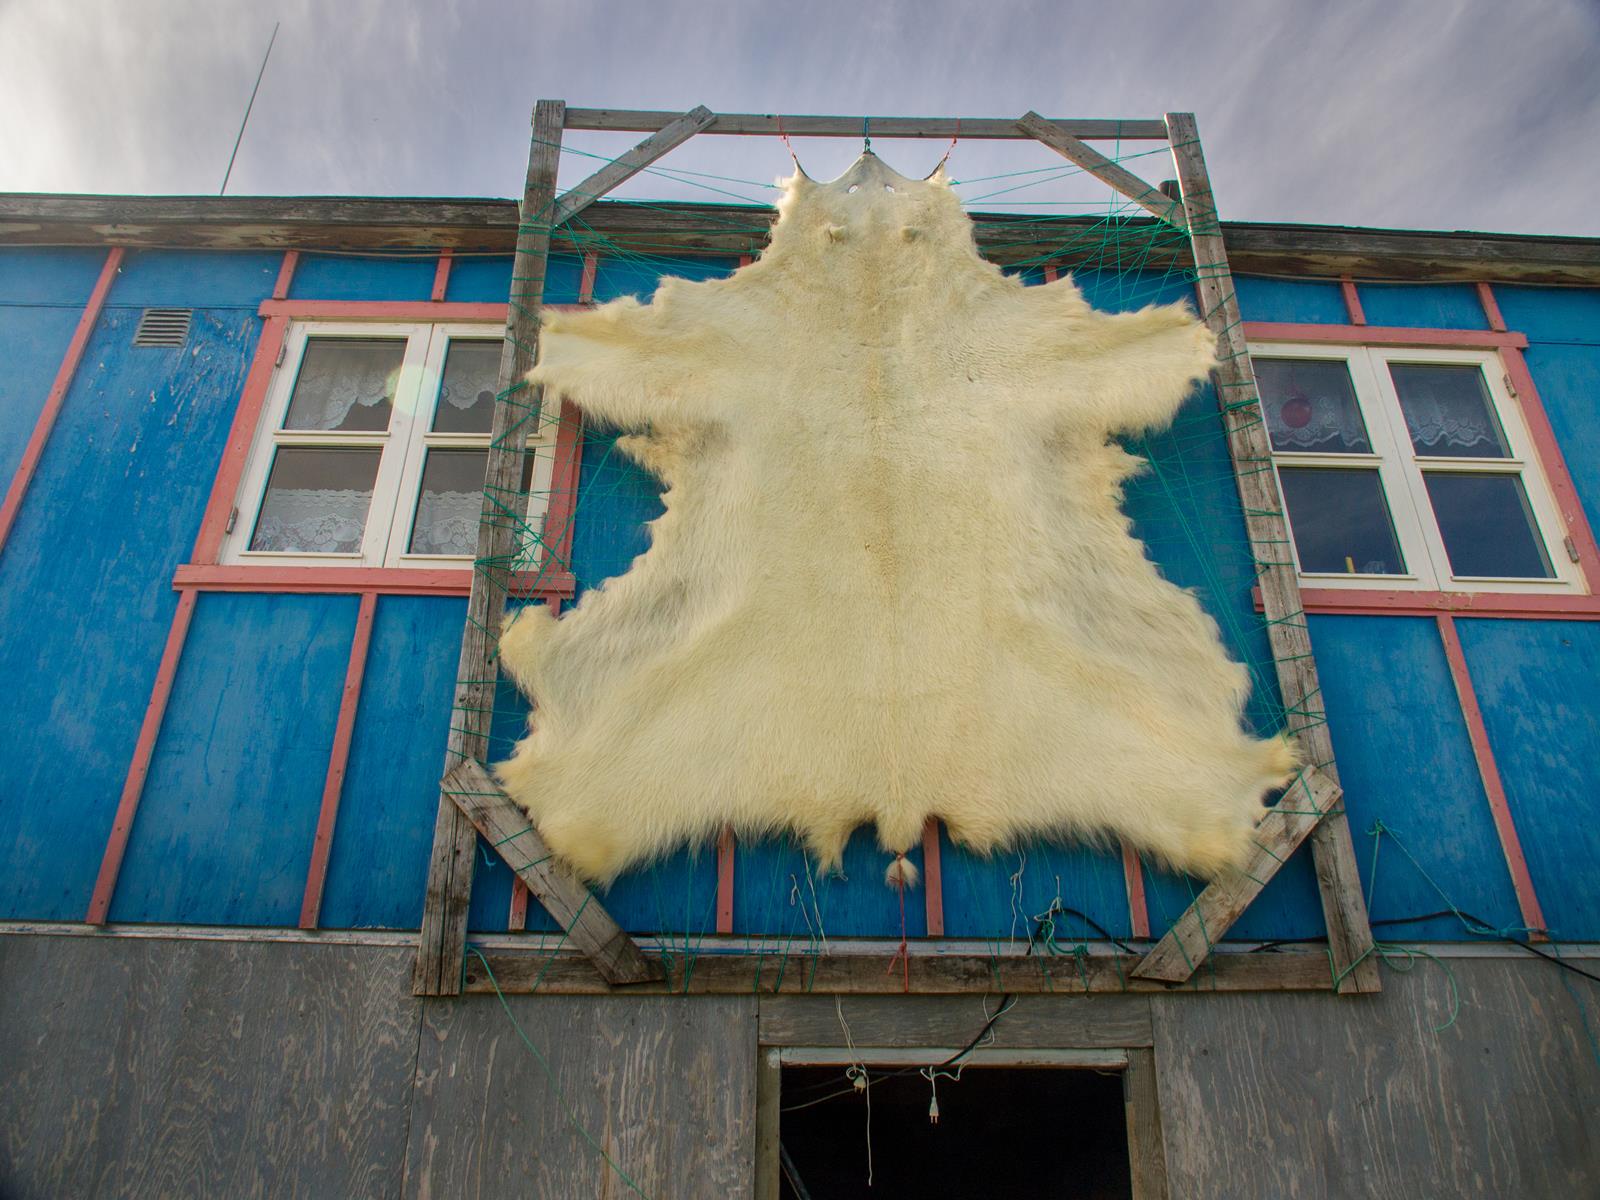
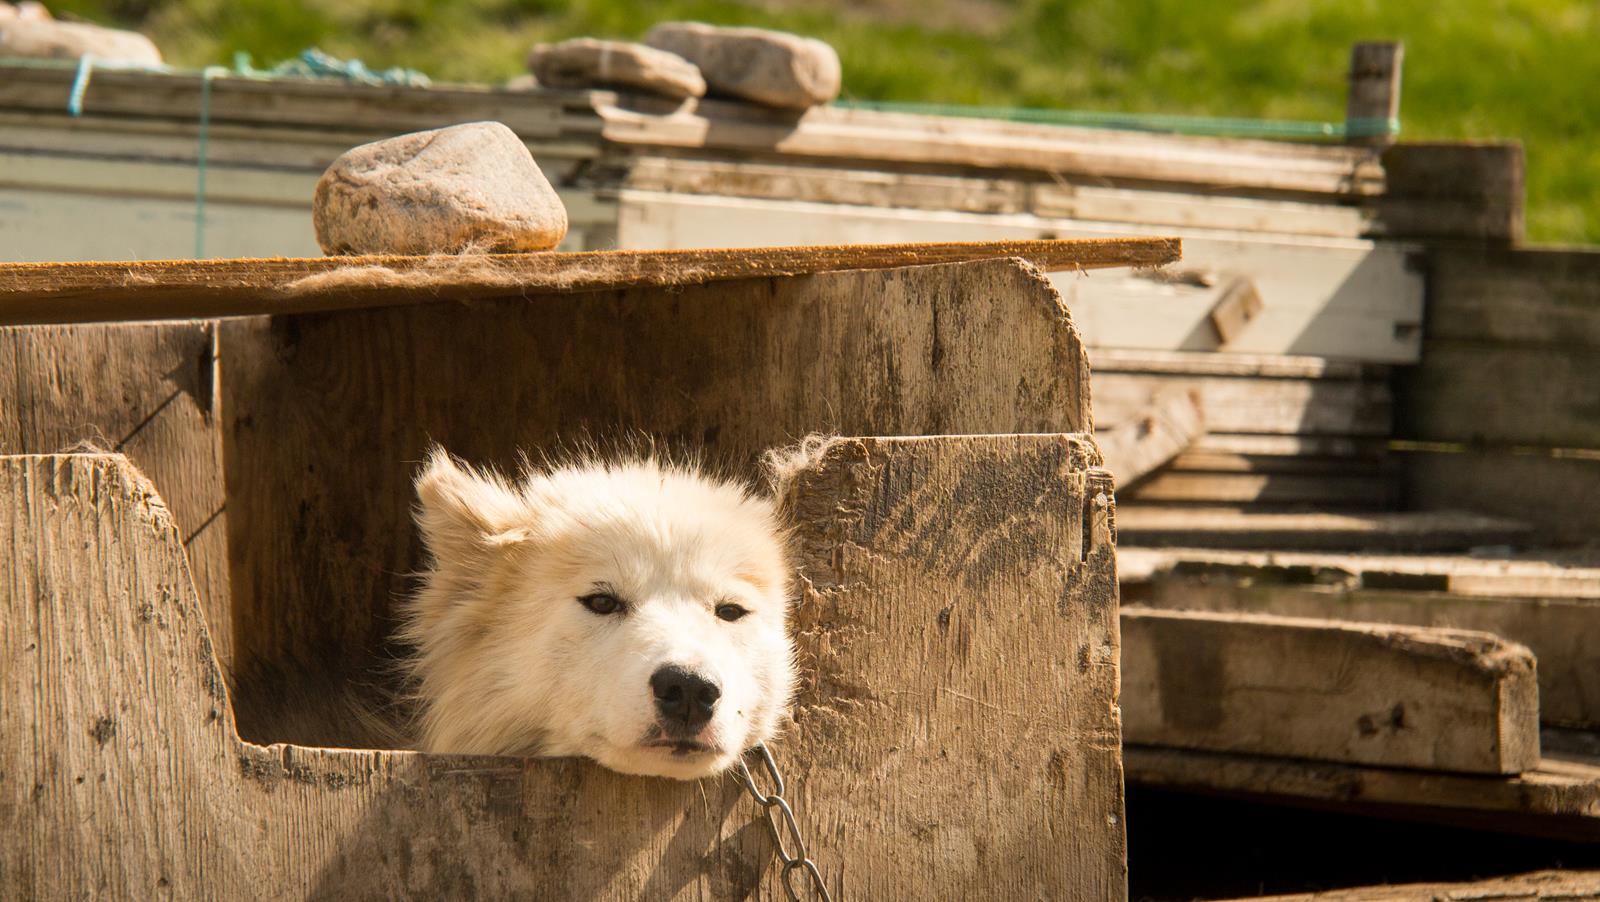
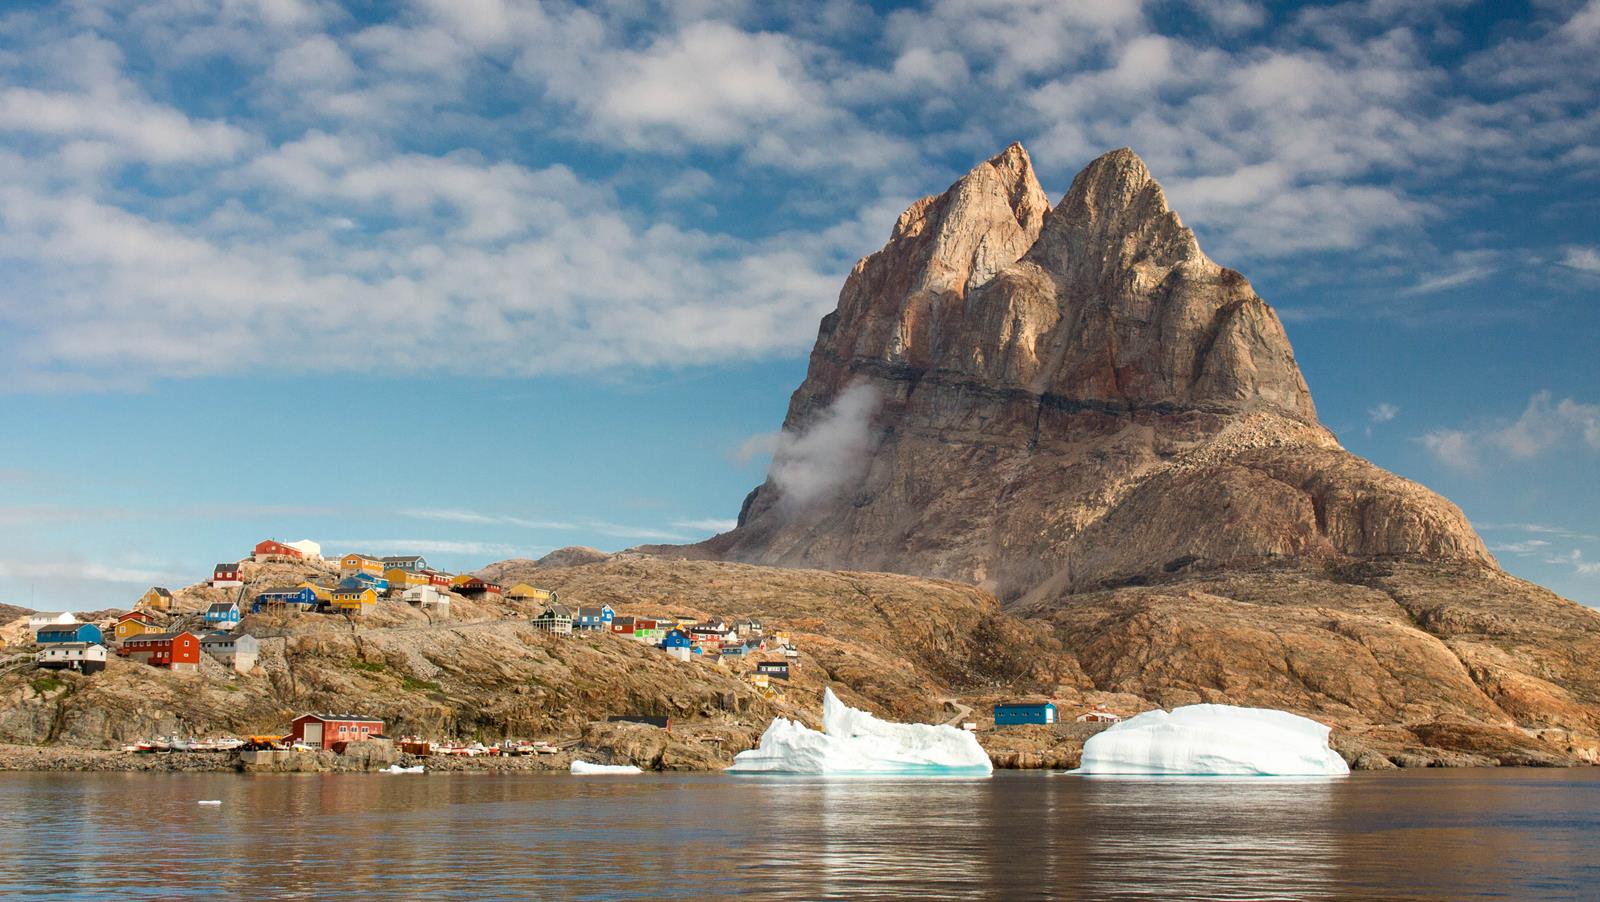
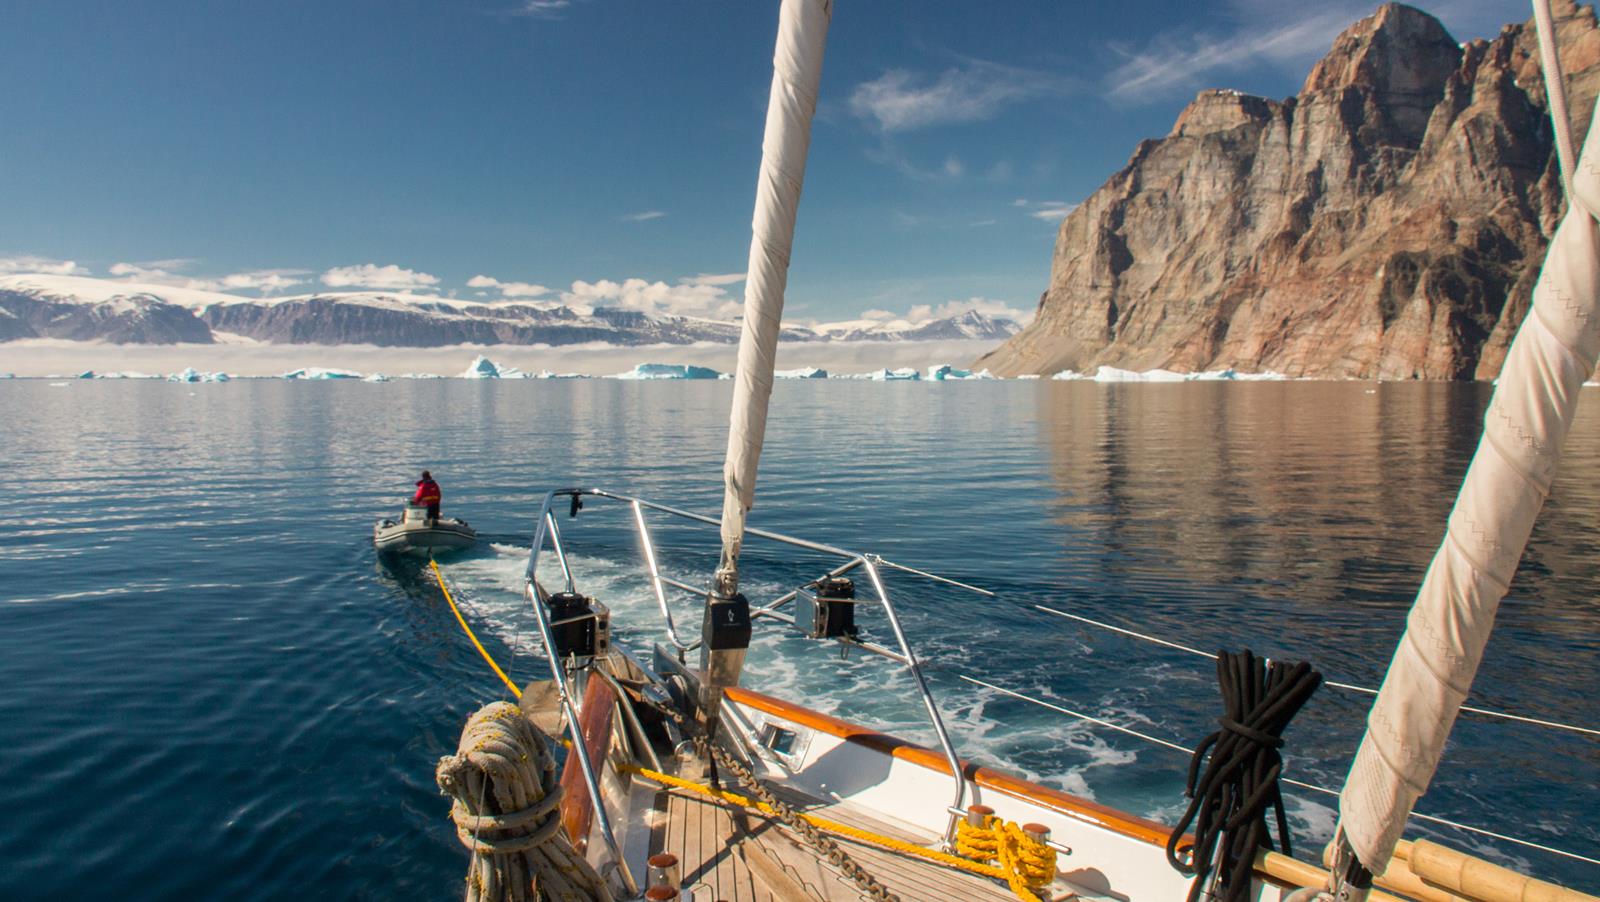
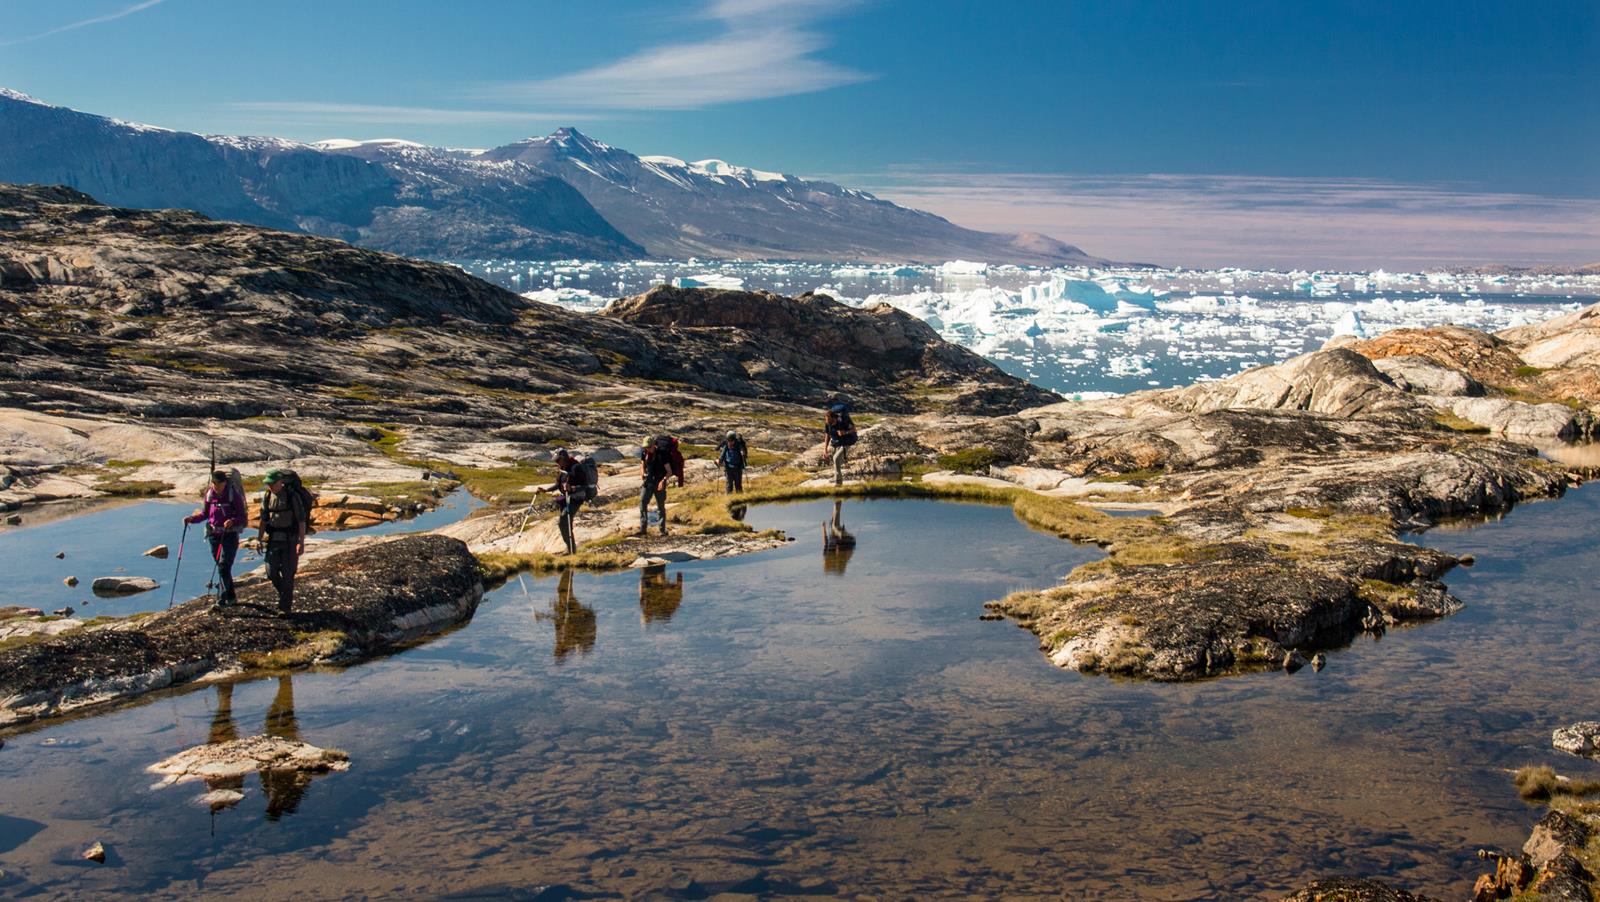
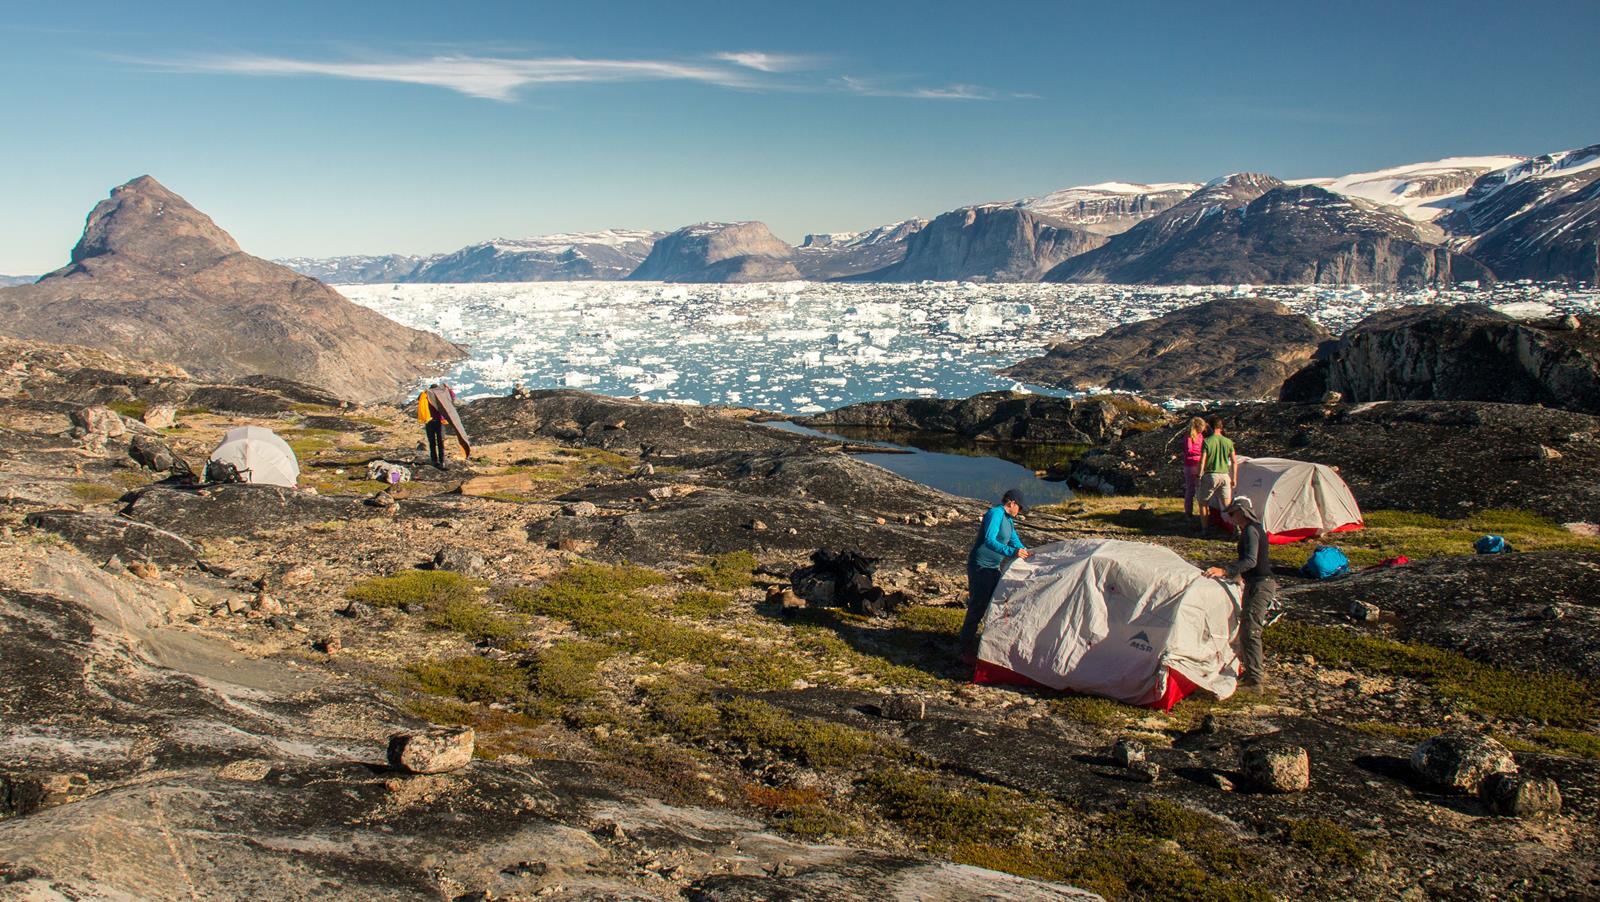
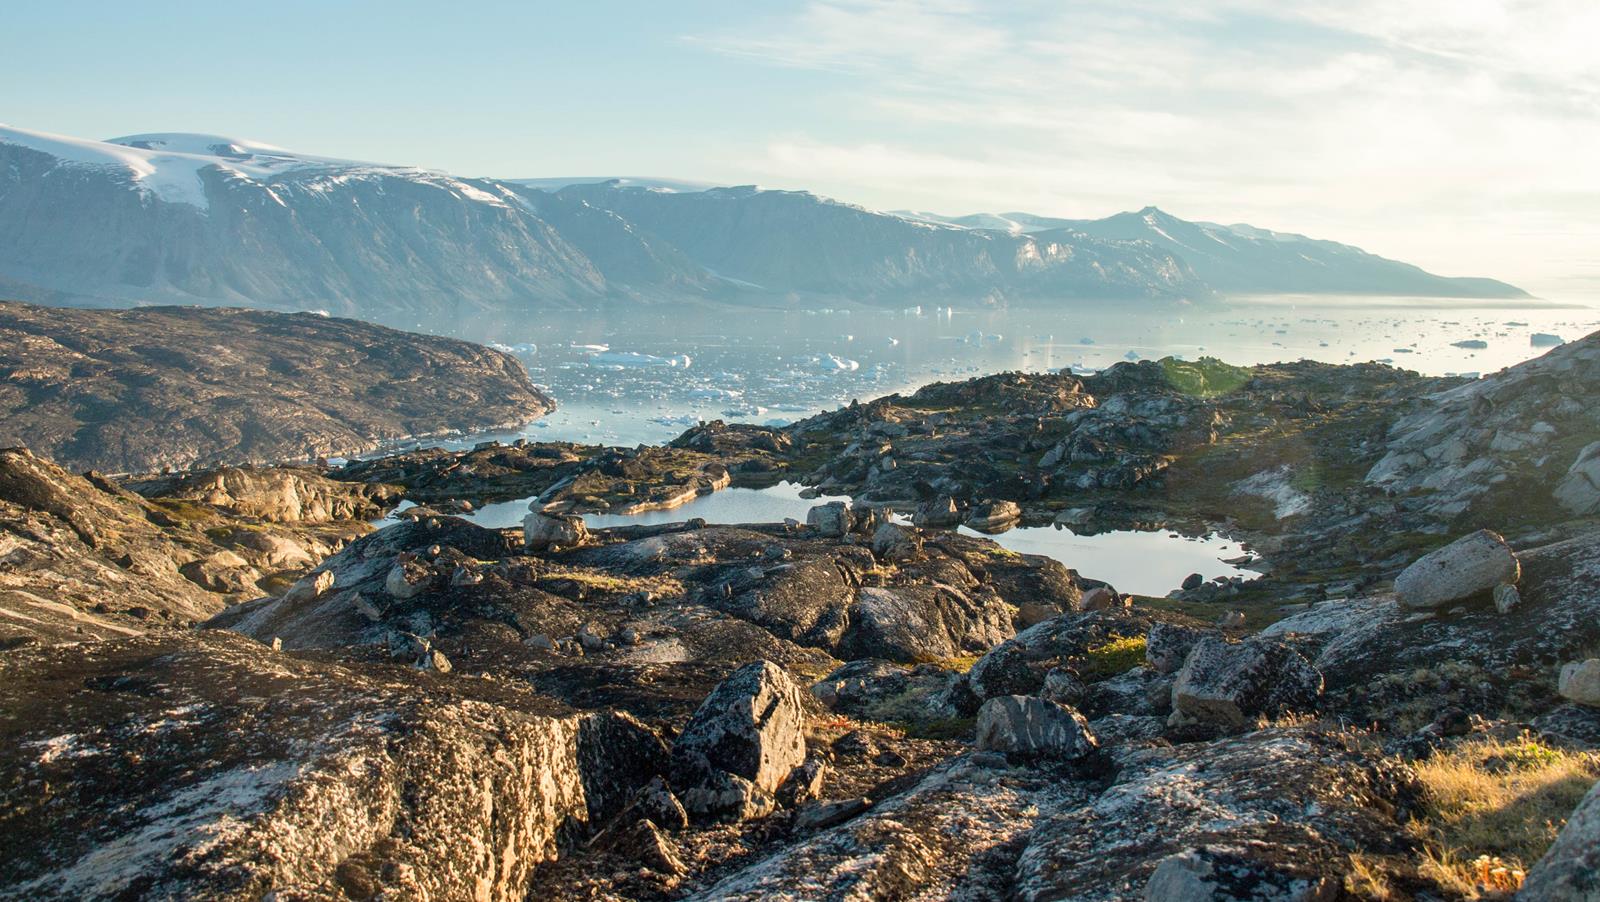
When the sea ice had sufficiently melted by early july, we sailed further north from Ilulissat, rounding the cape of the colorful Nussuaq peninsula into the vast Uummannaq fjord system. This was the part of the trip I looked forward to most prior to the journey – a true arctic nirvana of iceberg-dotted fjords teeming with humpback whales, jagged alpine mountains rising vertically from the sea, and extremely remote Inuit settlements like Niaqornat. Stable weather and midnight sun make this area even more worth the visit – although this is also the point where the polar bear risk starts to increase. We spent about two weeks in this area, making dayhikes and two overnight trips. The town of Uummannaq was our base camp – located at the base of an incredibly scenic mountain.
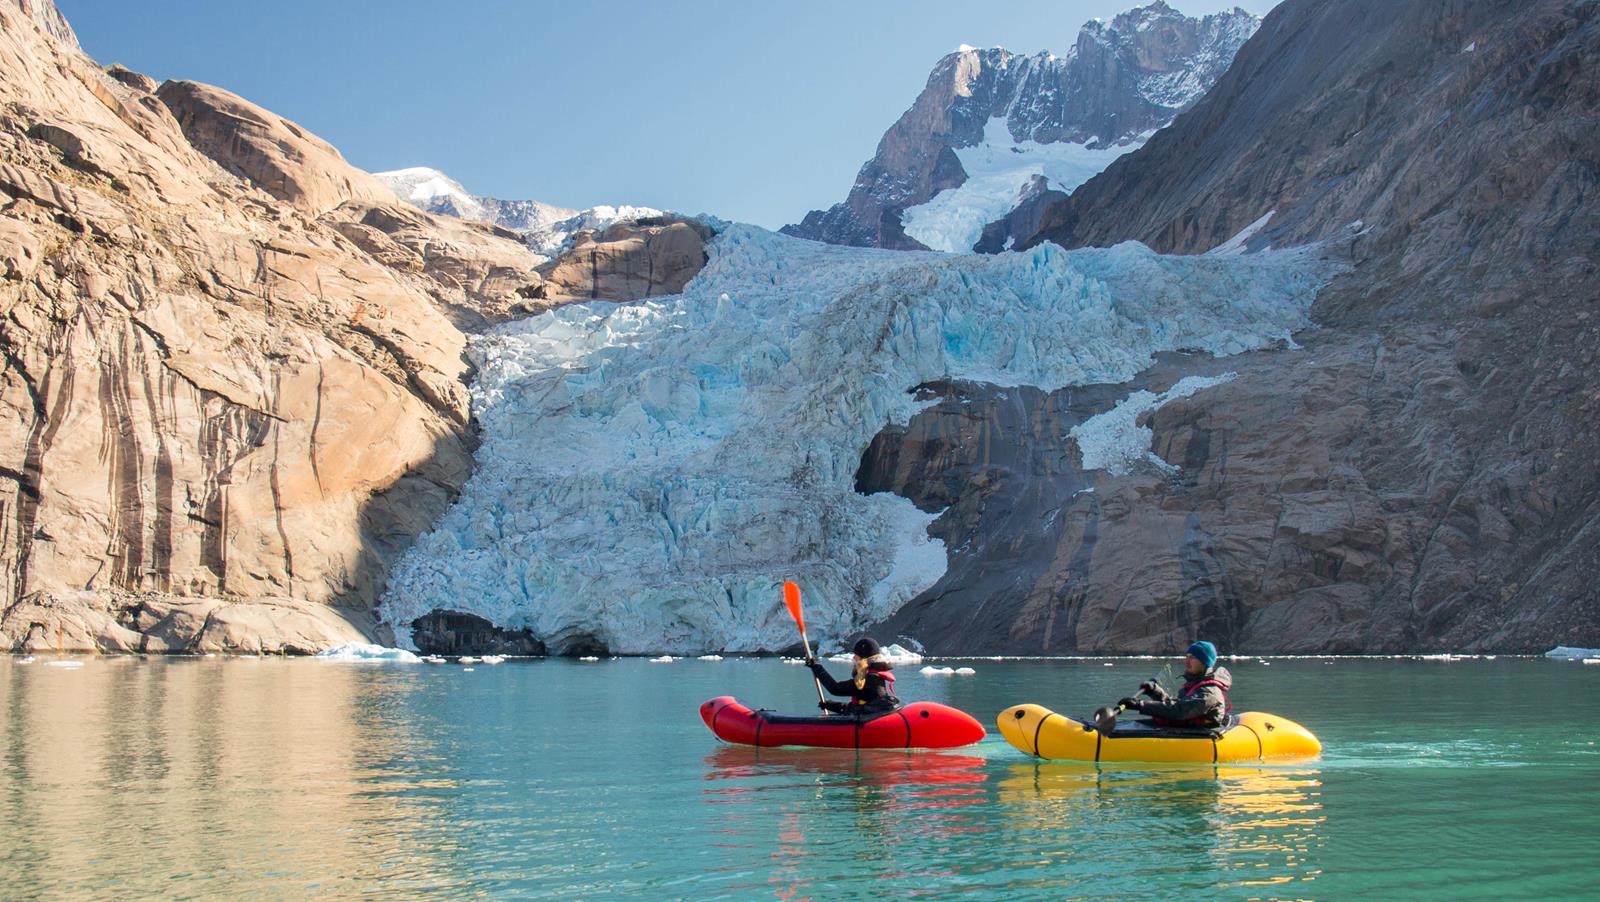
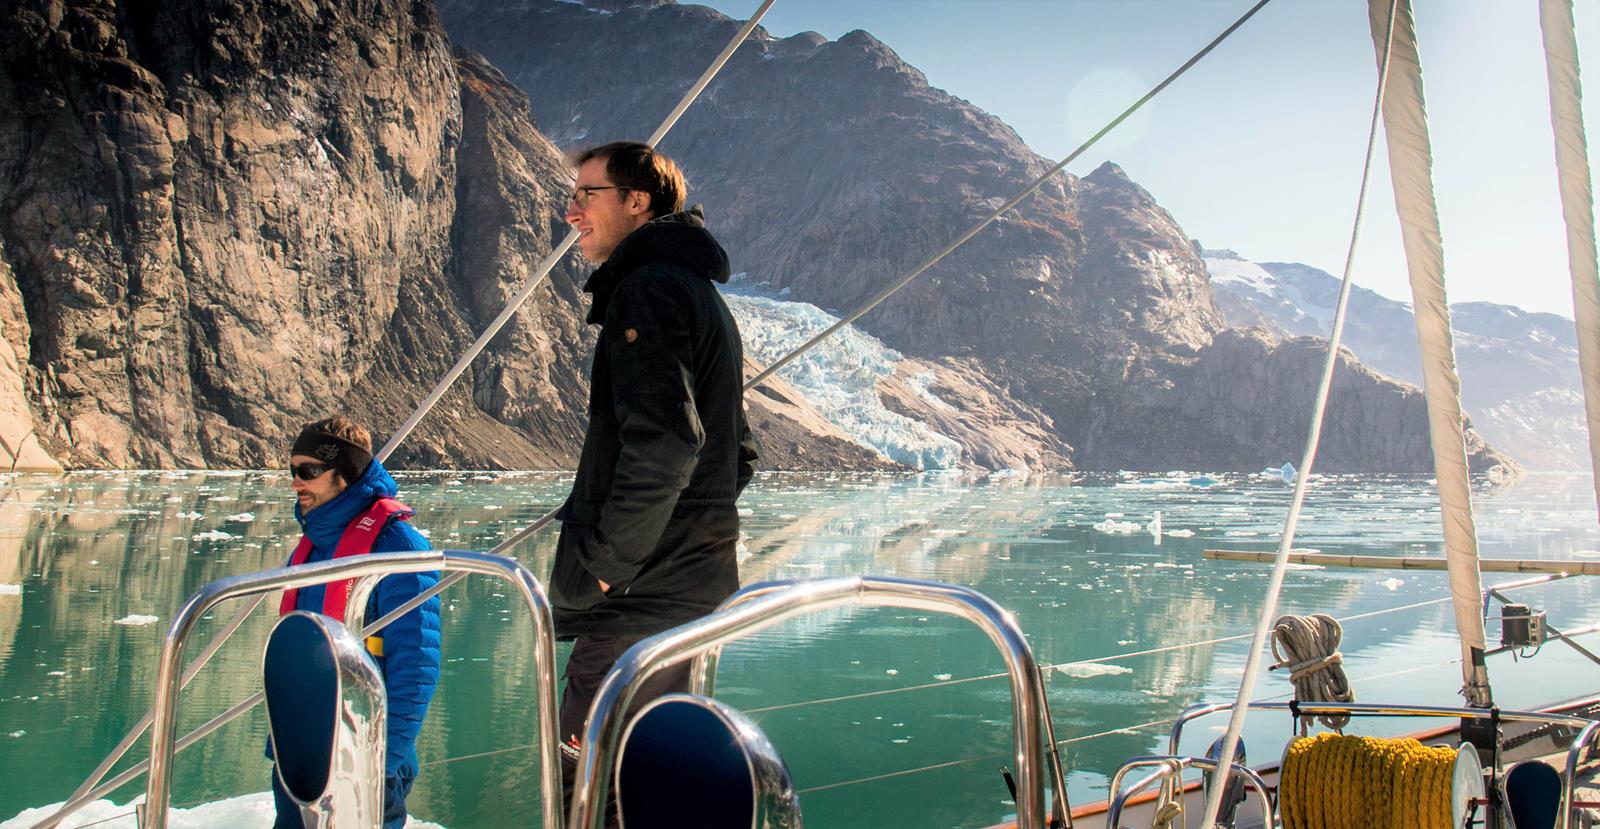
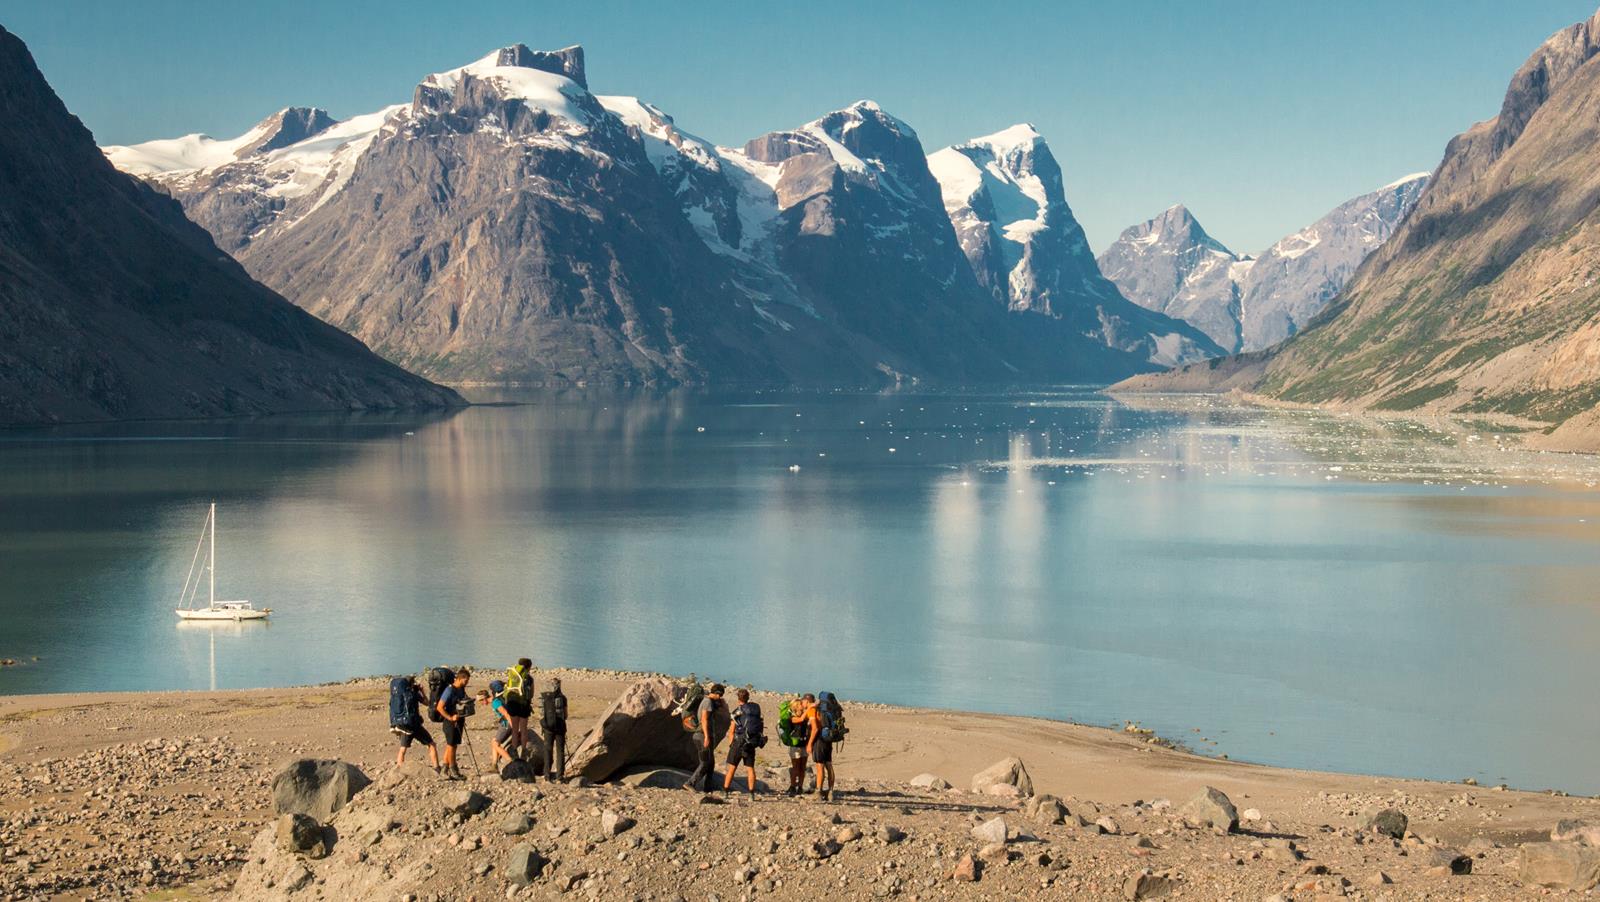
Last year I spent my first full summer season guiding in Greenland. Together with Sofie Vanmaele, I chartered a 90ft sailing vessel, which sailed across the Atlantic in may. From the early june until late september, we explored the entire West Coast from Cape Farewell all the way up to the fjords near Uummanaaq – a stretch of coastline of approximately 1500km. 9 groups of friends and family came over to join us while hiking and packrafting through some of the most sensational backcountry on earth – the yacht offered a luxurious base camp and allowed us to visit places which are virtually inaccessible by any other means of transport. It was a fantastic opportunity to finally show them around in those remote areas I love and admire so deeply, without leaving real traces behind.
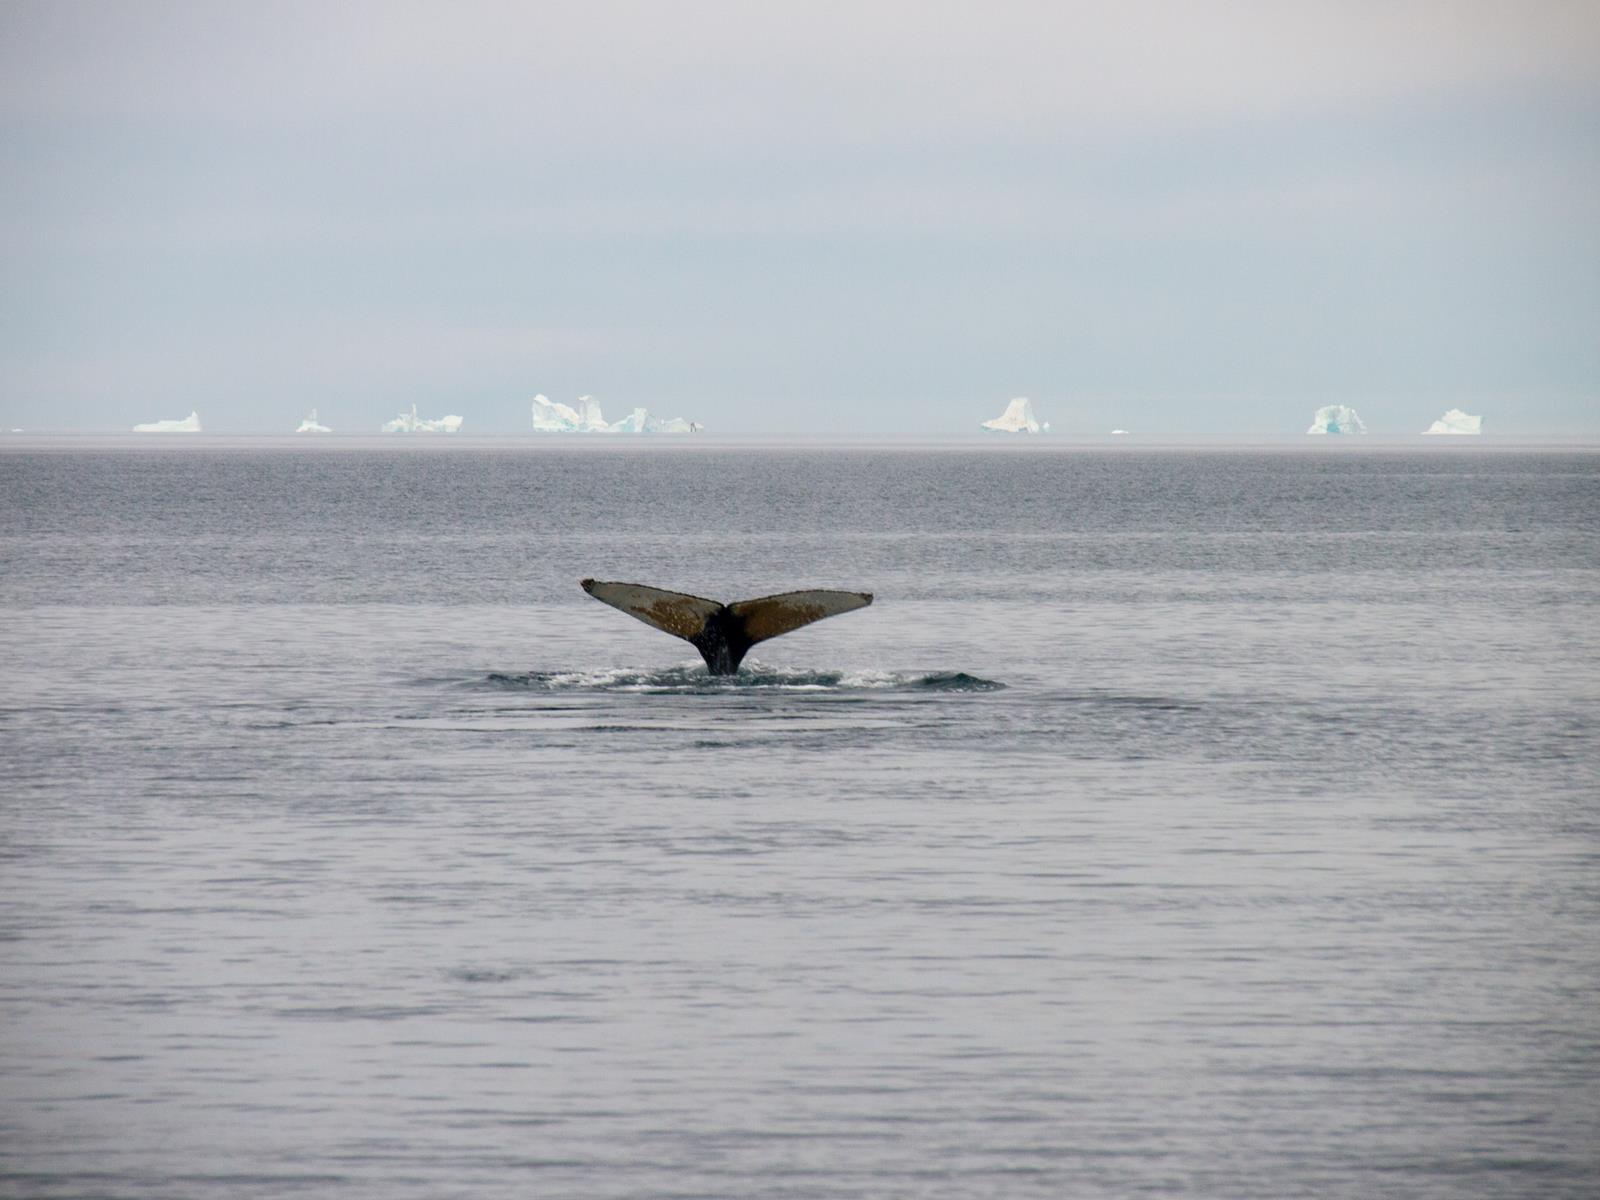
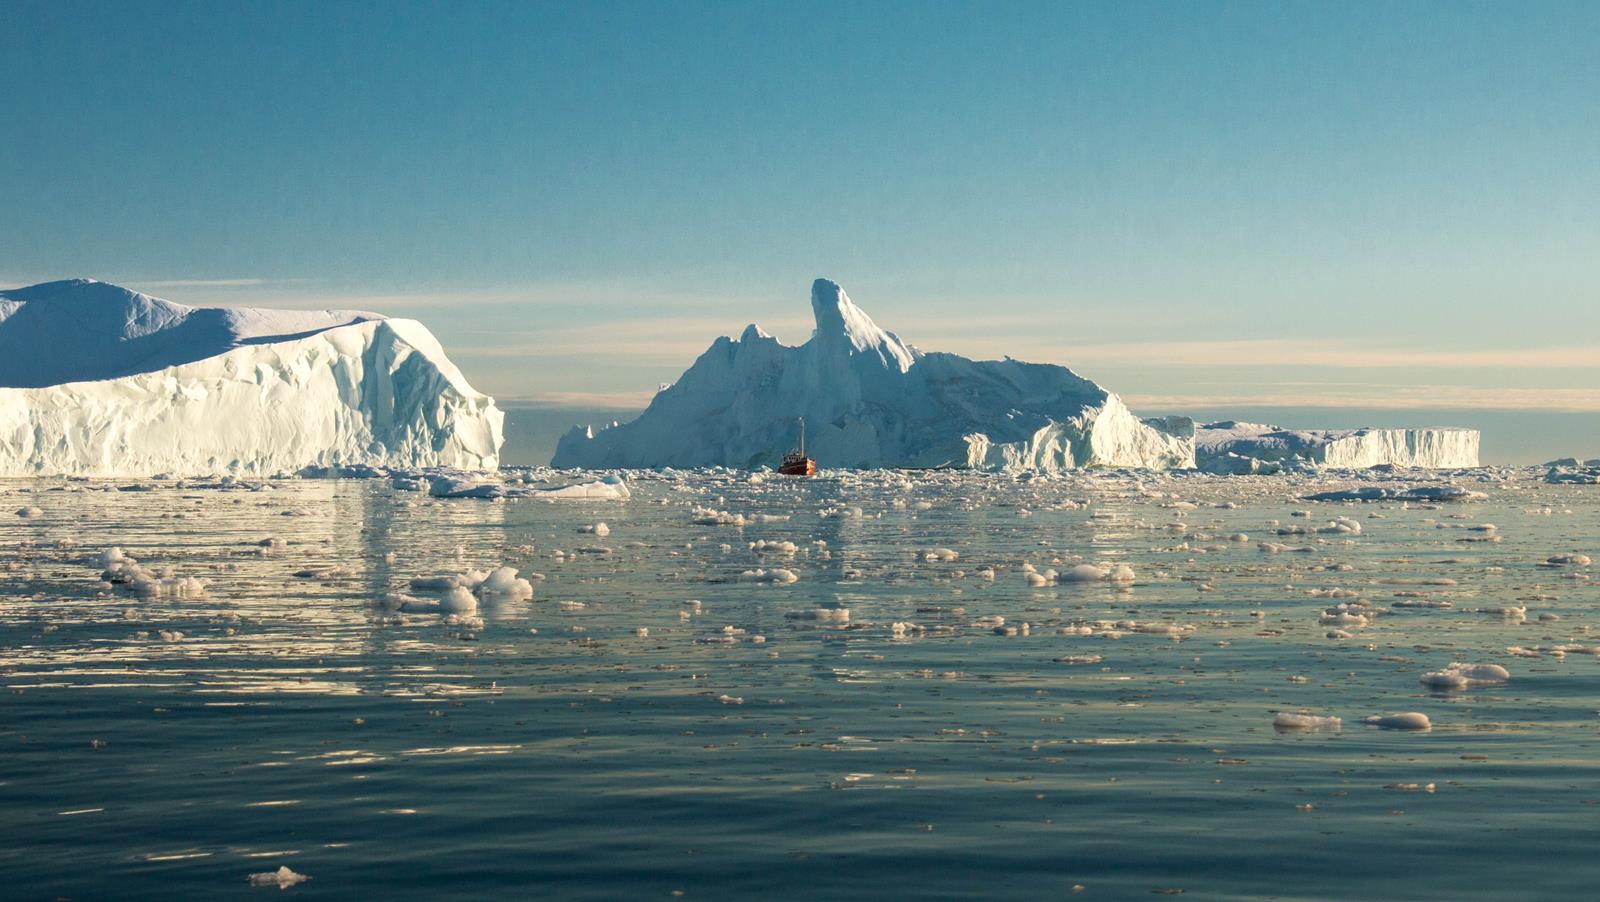
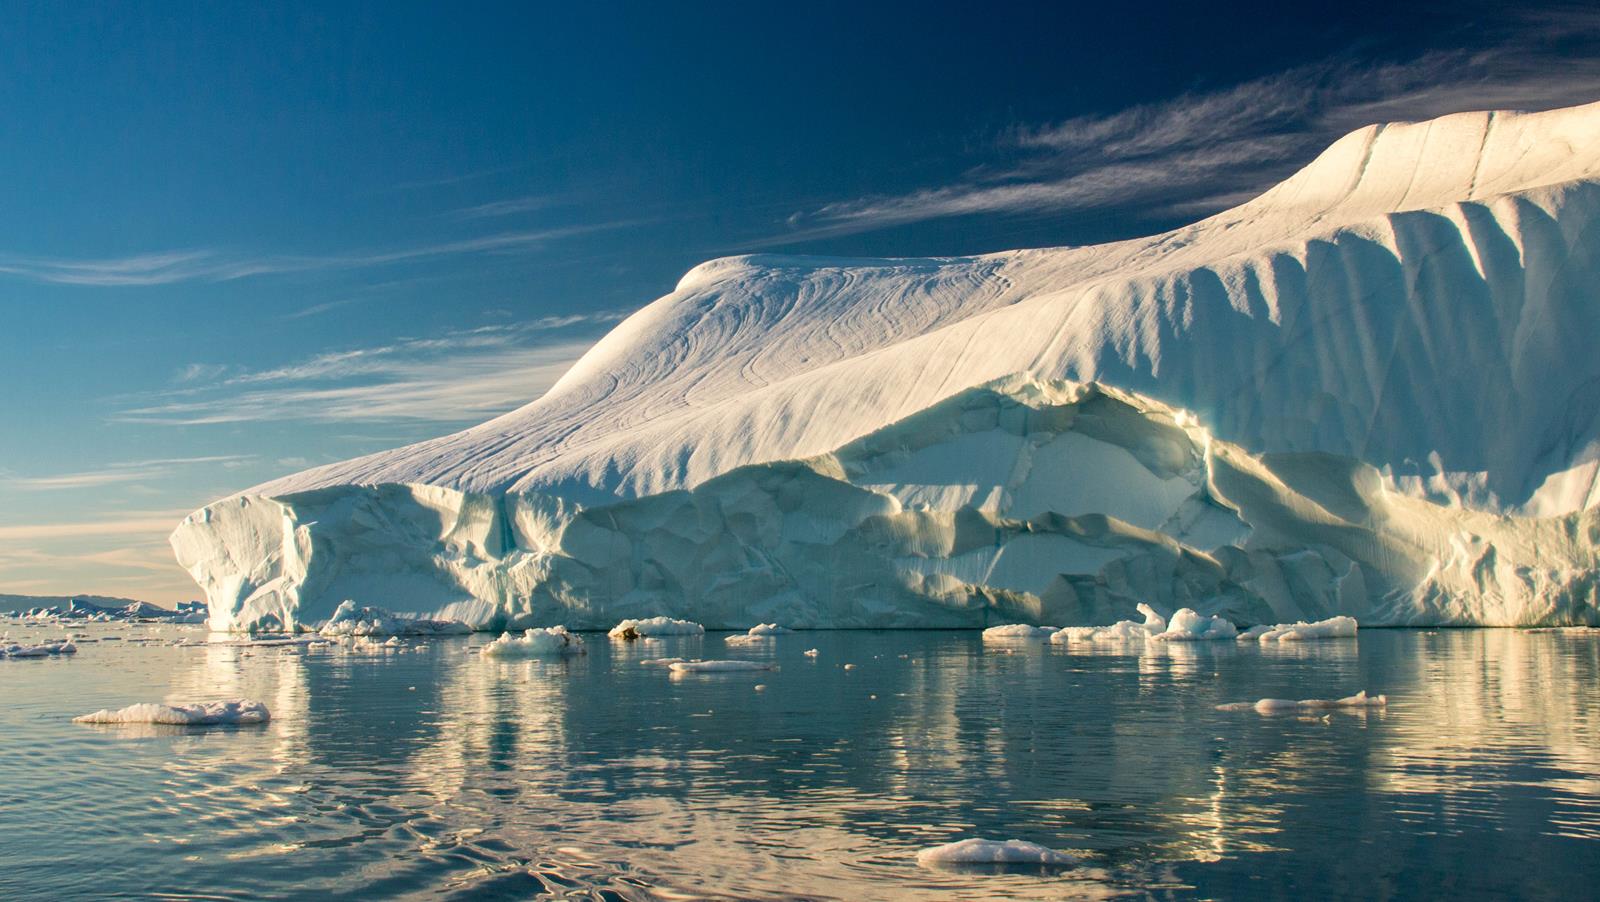
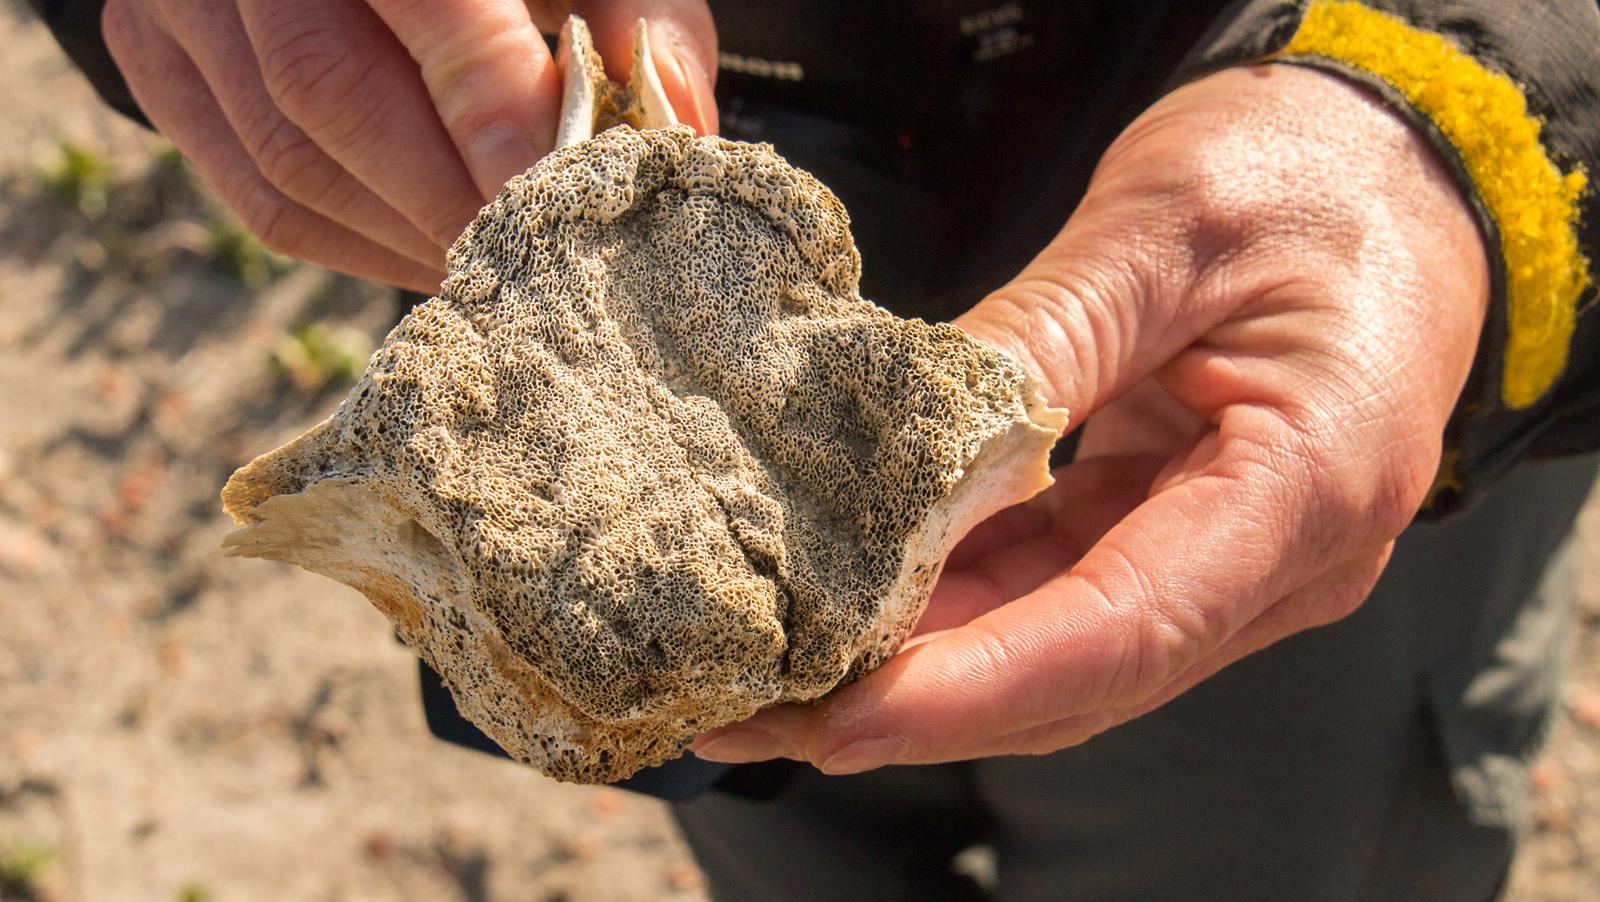
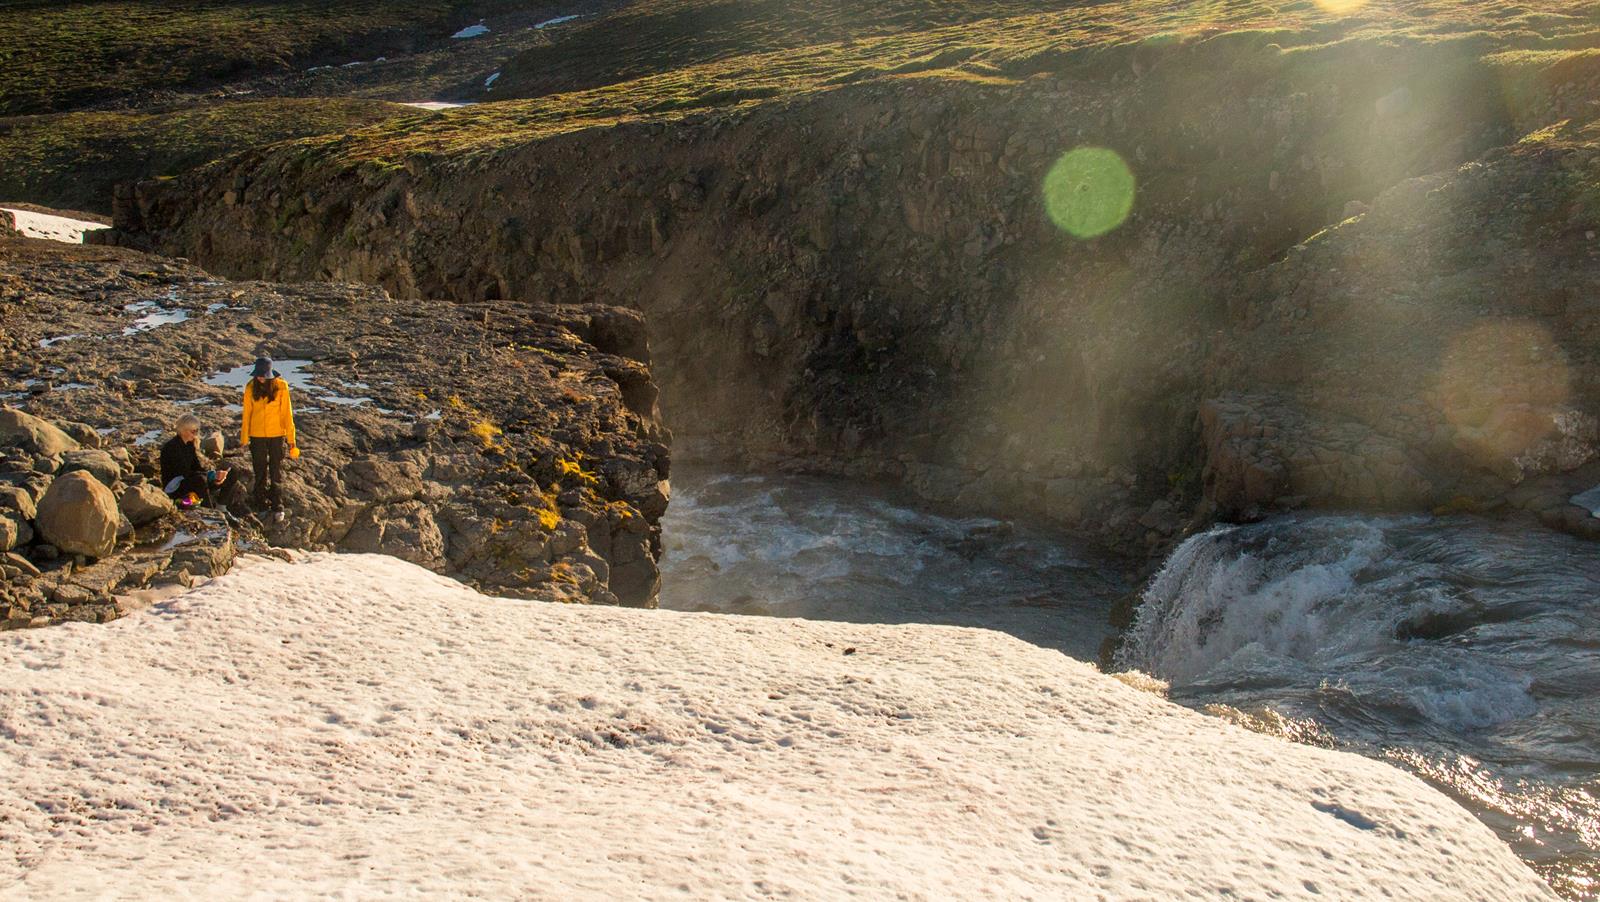
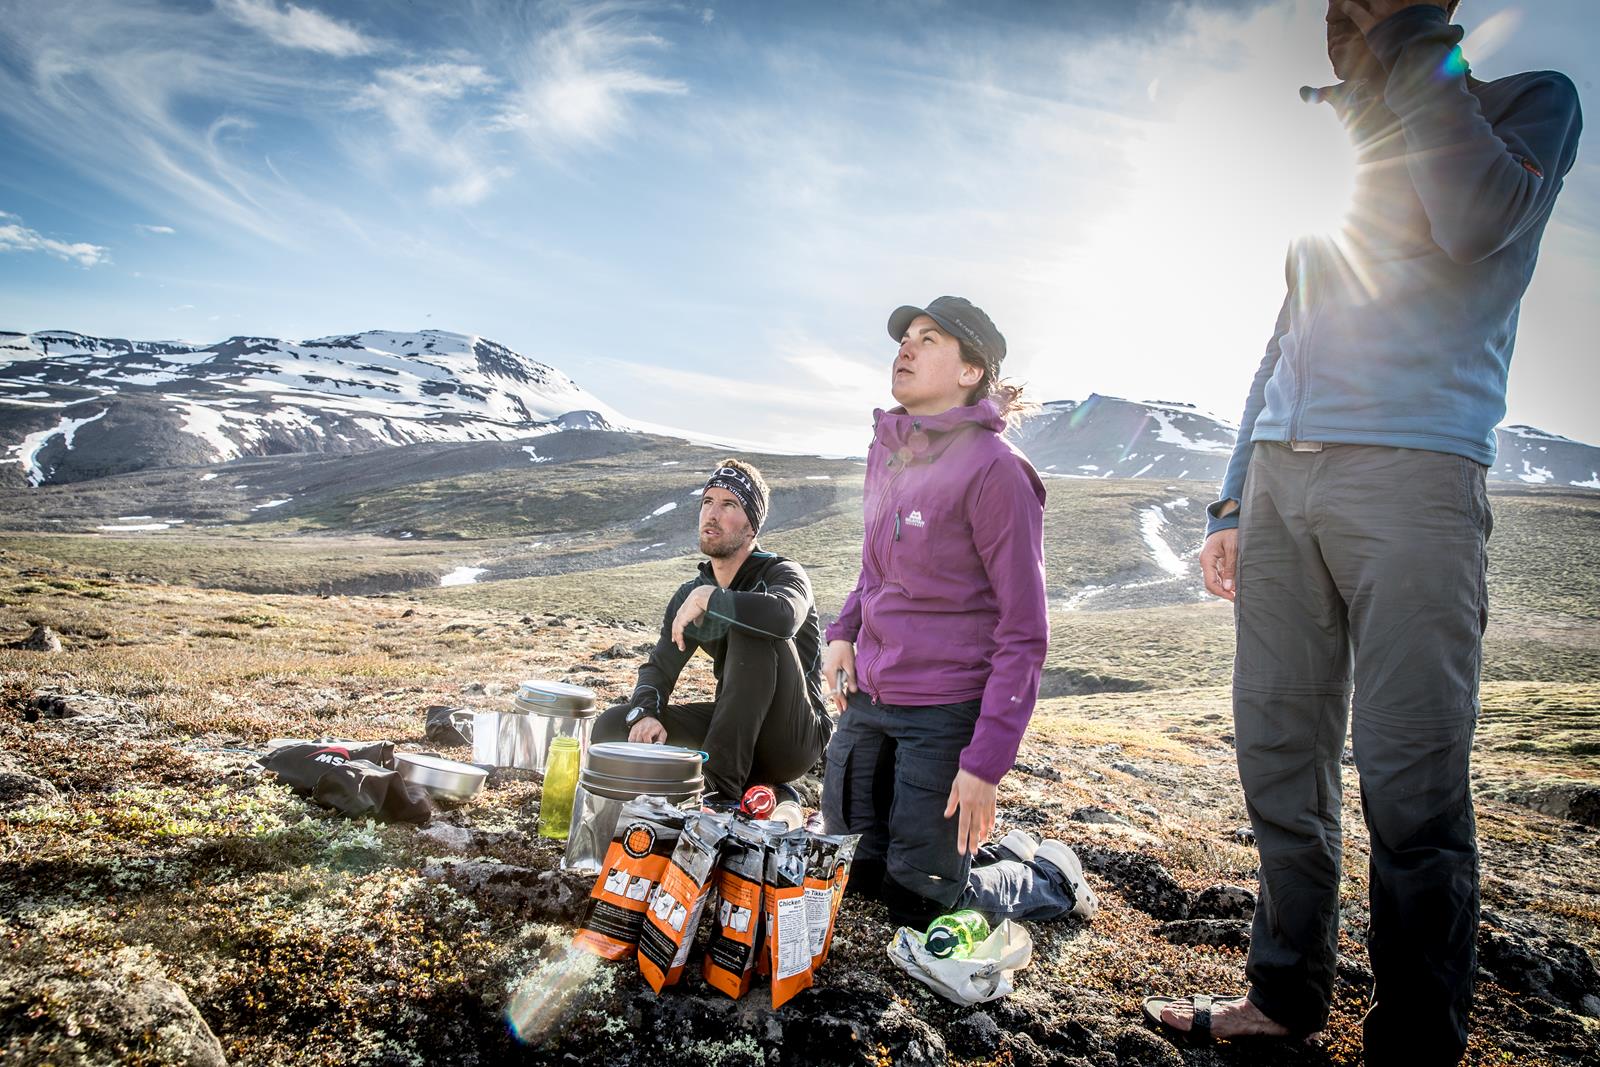
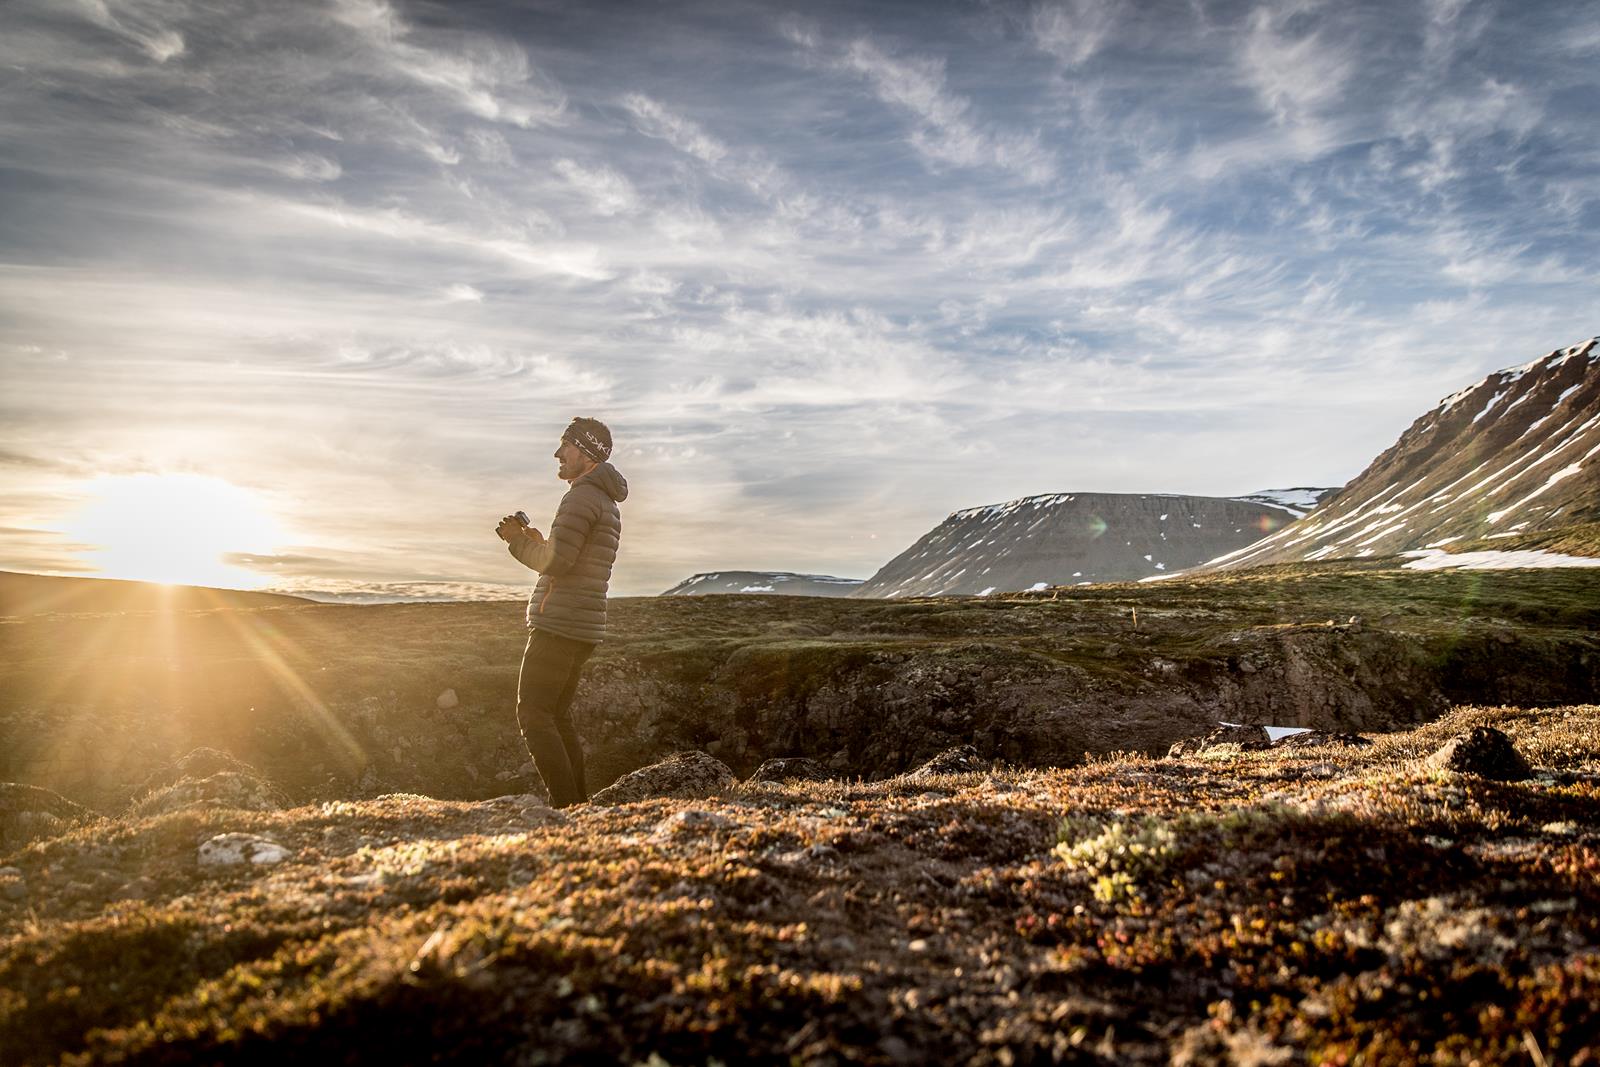
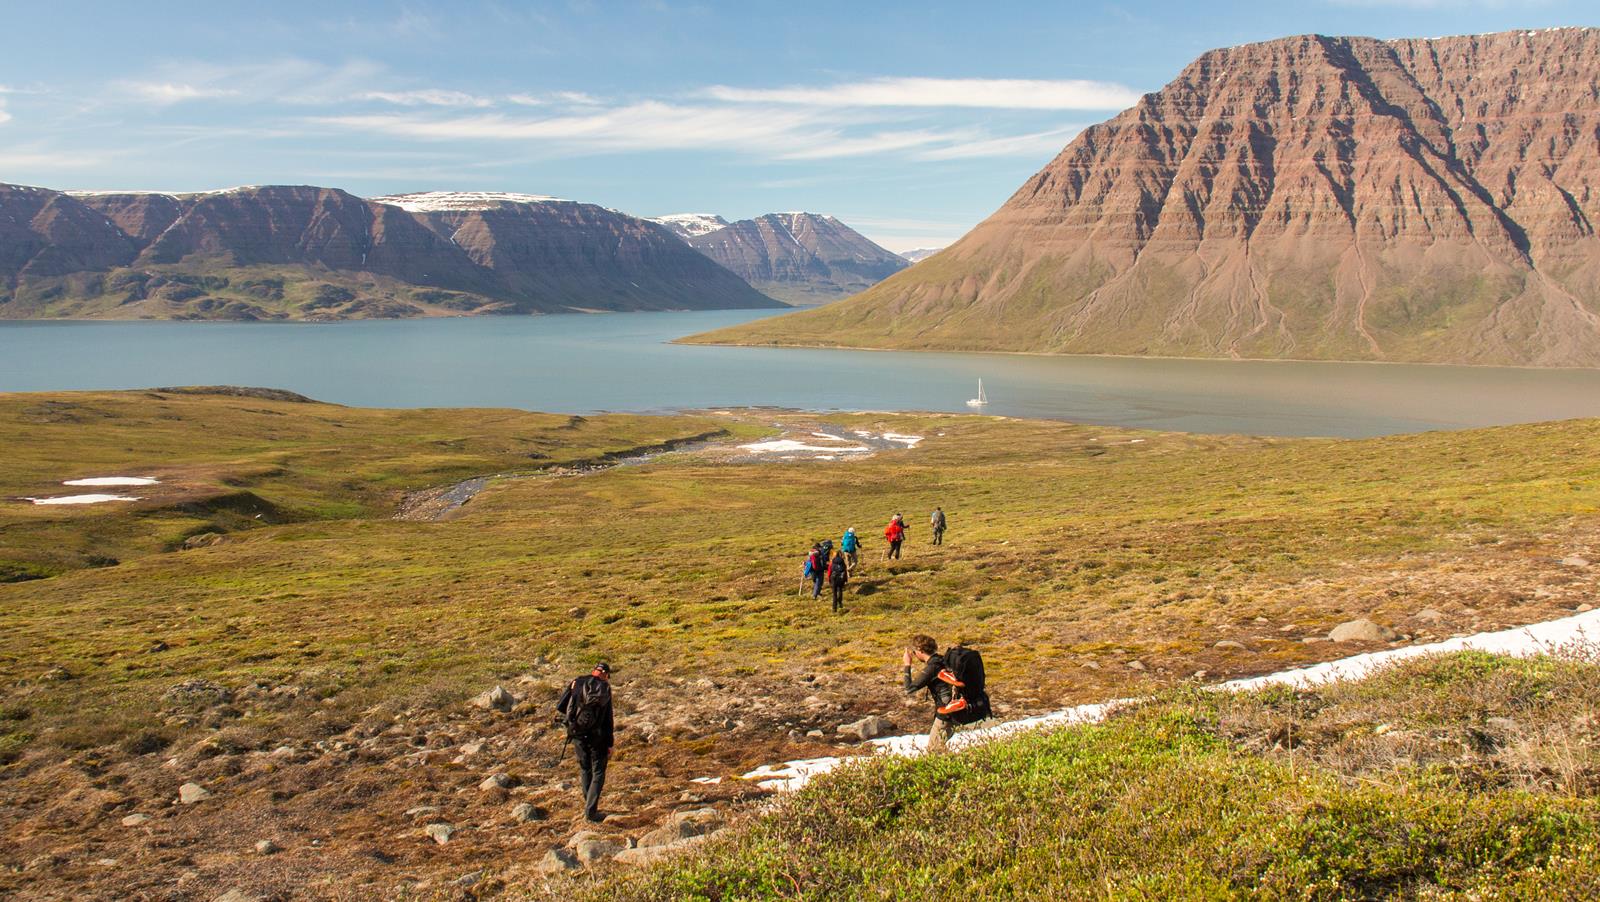
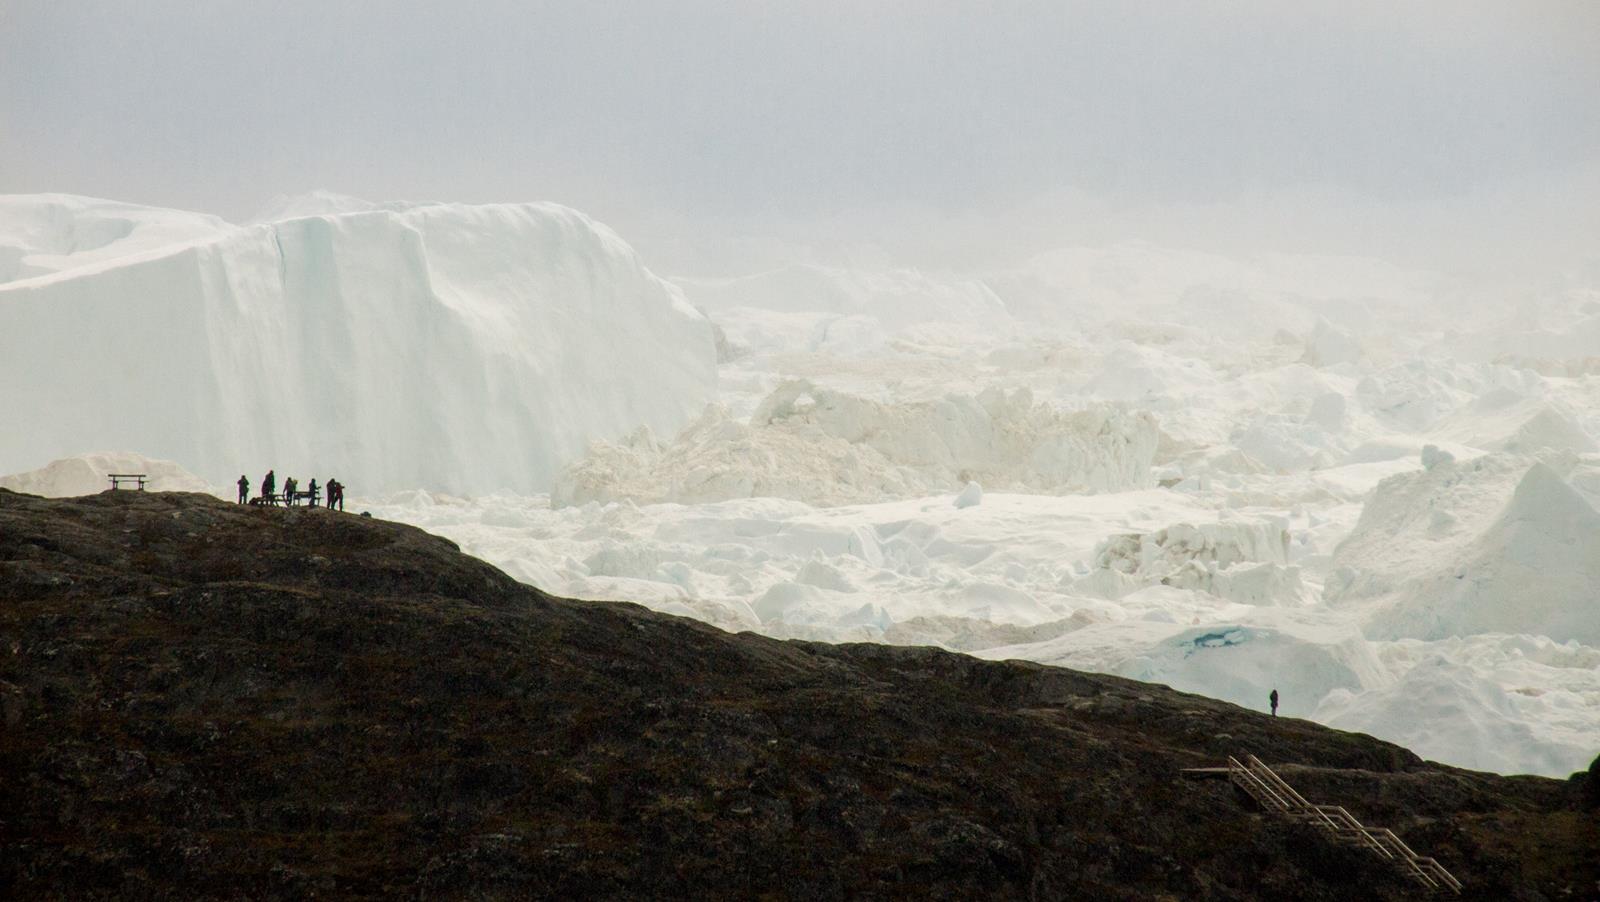
In late june, we sailed north from Sisimiut towards Ilulissat, chasing the disappearing winter ice. The trip focussed on the southern half of Disko Island, where we made several day hikes and 2 overnight trips. Whilst Greenland is largely made up of very old plutonic and metamorphic rocks, Disko Island is a ‘young’ (approx. 50 million years) island almost completely composed of basaltic rocks related to the opening of the Davis Strait. The surrounding seas – with countless humpback whales – are dotted with massive icebergs due to the proximity of the Ilulissat Icefjord.
My mom joined on this trip! Finally I could show her around in this arctic wonderland!
It has been a very long time since I’ve been blogging here – luckily not because I’ve just been at home doing nothing 😉
Last year I spent my first full summer season guiding in Greenland. Together with Sofie Vanmaele, I chartered a 90ft sailing vessel, which sailed across the Atlantic in may. From the early june until late september, we explored the entire West Coast from Cape Farewell all the way up to the fjords near Uummanaaq – a stretch of coastline of approximately 1500km. 9 groups of friends and family came over to join us while hiking and packrafting through some of the most sensational backcountry on earth – the yacht offered a luxurious base camp and allowed us to visit places which are virtually inaccessible by any other means of transport. It was a fantastic opportunity to finally show them around in those remote areas I love and admire so deeply, without leaving real traces behind.
In the coming weeks, I will finally share some pictures from this long and intense adventure. The first series is from our first leg from Nuuk to Sisimiut in early june on the onset of summer. We spent most time in the fjordlands near Maniitsoq, notably the astounding Eternity Fjord which I had already visited during my 2016 solo expedition. Enjoy!
I’m not the type of hiker who keeps going to the same region time after time – but rather like to explore new areas on every trip. The Vercors, a wild karstic limestone plateau in the French pre-alpine ranges with summits along the eastern rim peaking to 2000-2369m, is kind of an exception to this rule. I crossed the Vercors with a bunch of friends in winter 2007 (my first winter trek!) and returned in 2009 for my first solo winter trip. Last year, Fre joined me for a first first early summer reconnaissance of the Mont Aiguille – Grand Veymont area.
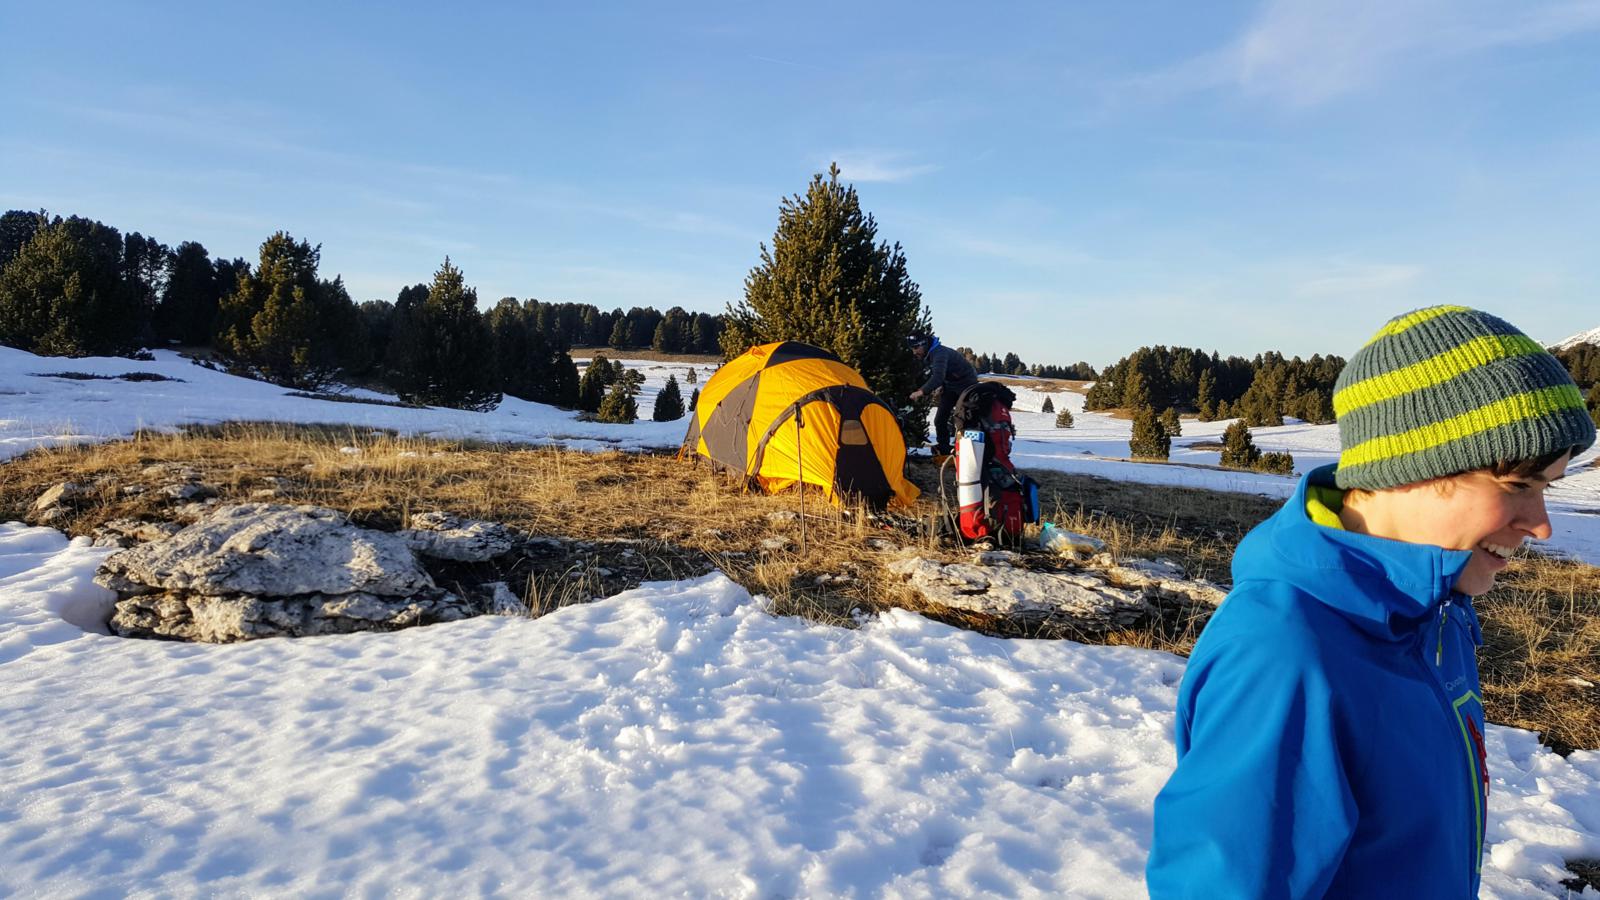
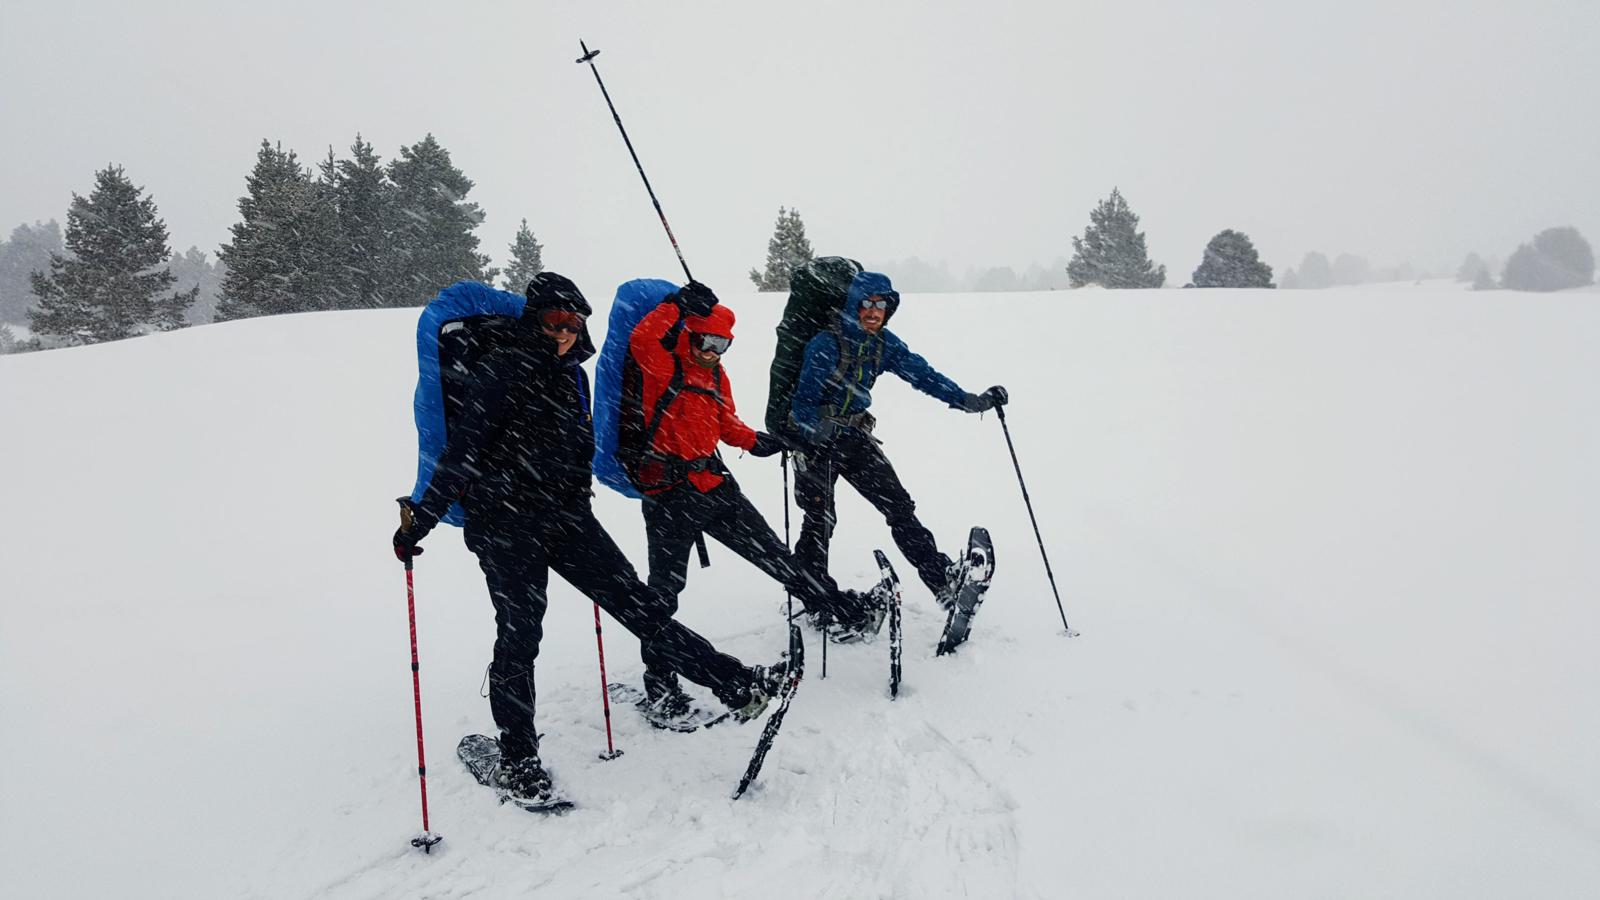
When I started making plans for a snowshoe flap with Björn, Marjolijn, Siegried, the Vercors was on our list again from the start. The huge advantage of the plateau is that one can design beautiful varied routes with only minimal avalanche danger, and there is a whole bunch of small mountain cabins where you can spend the night in adverse weather conditions. So, as our 7-day trip started to draw closer and the weather forecast looked complicated, we decided to drive to Col de Rousset, the most direct access point to the interesting southern part of the area.
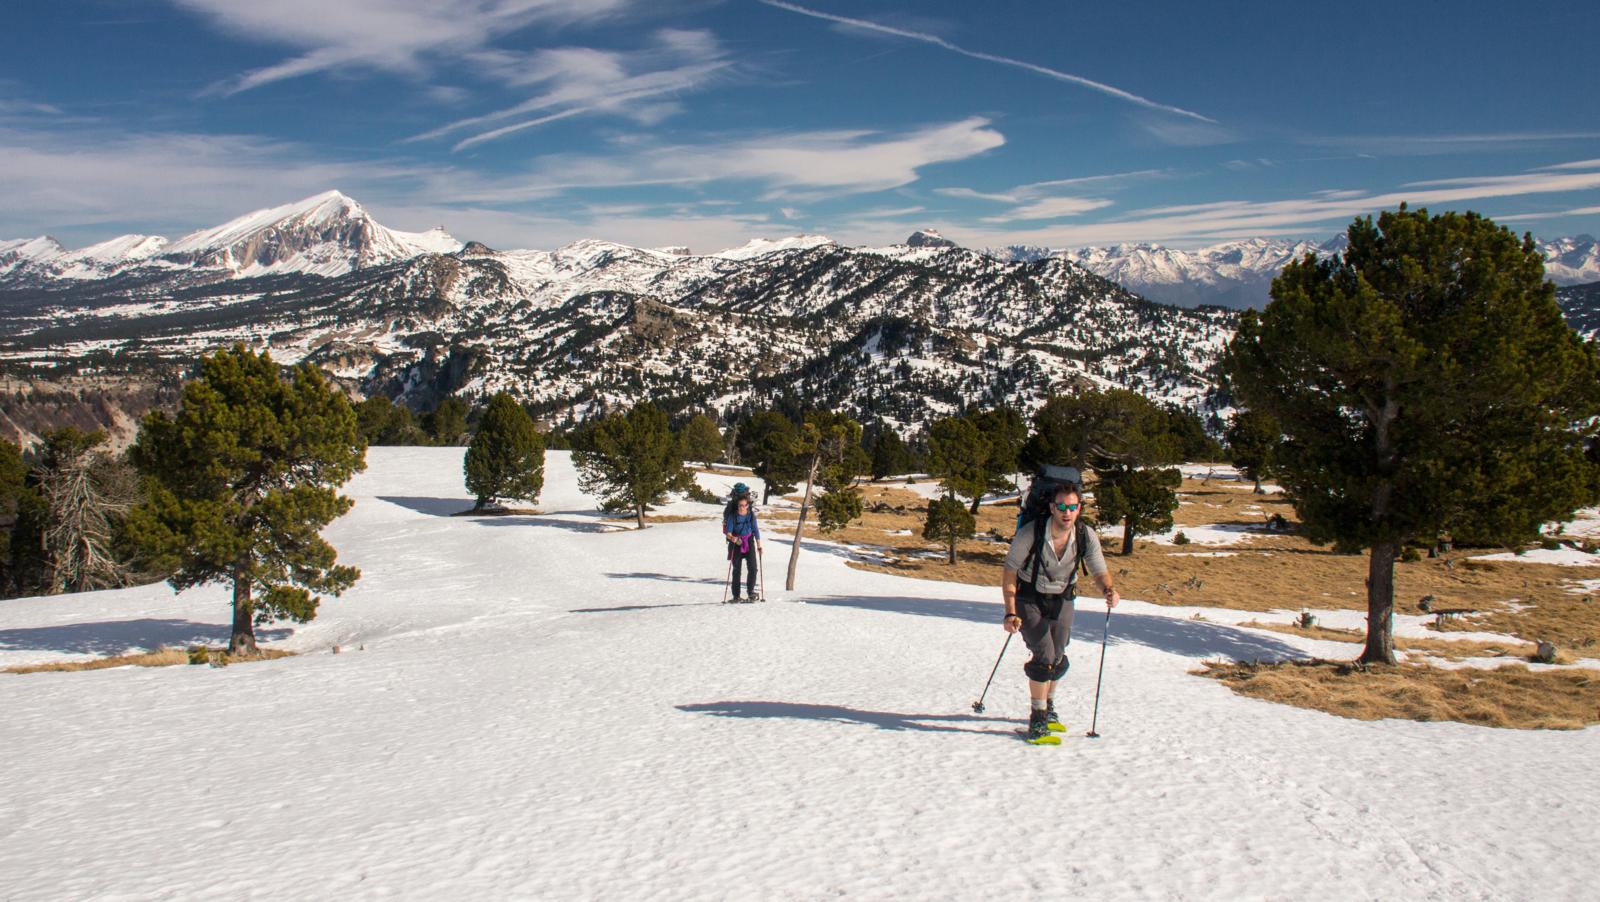
It was the most varied trip I have made in the Vercors so far, with a few less classic routes. The weather shifted from spring conditions to a few windy, dull days with snow and rain, and finally to beautiful sunny weather again. We adapted our route to the conditions to get the very best out of the trip – and I have to say we were pretty successful in doing so 🙂 Enjoy!
Hiking from Col de Rousset to Cabane de Pré Peyret on the first day.
Hiking from Col de Rousset to Cabane de Pré Peyret on the first day.
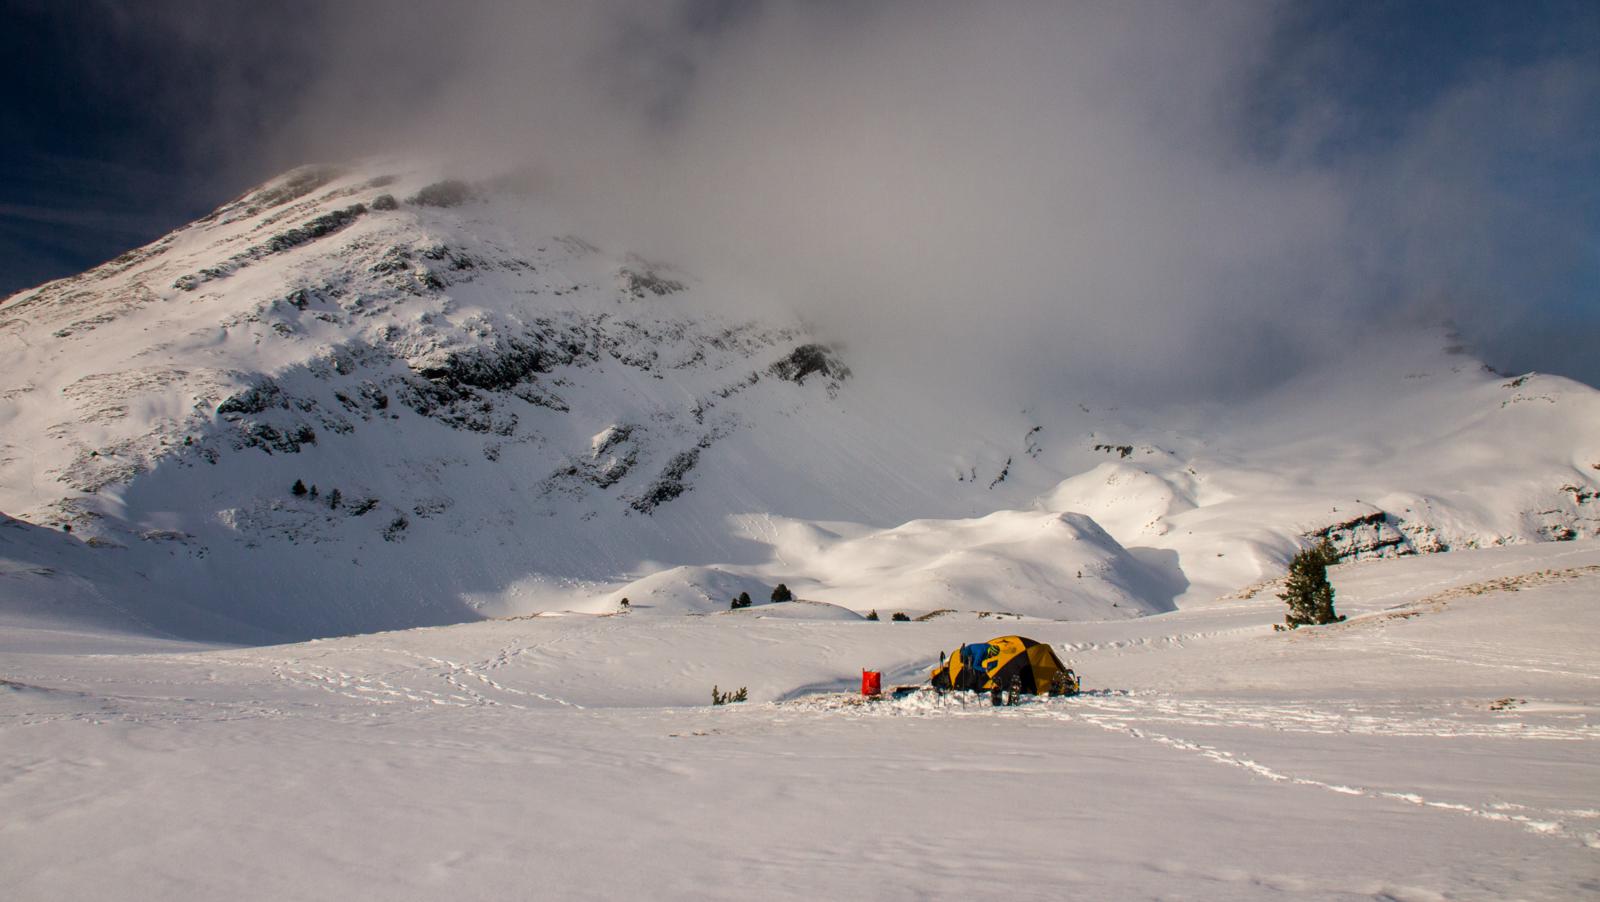
First camp near Cabane de Pré Peyret
First camp near Cabane de Pré Peyret
Climbing towards the summit of Rocher de Plautret
Sunrise over the Southern French Alps from Tête du Petit Jardin
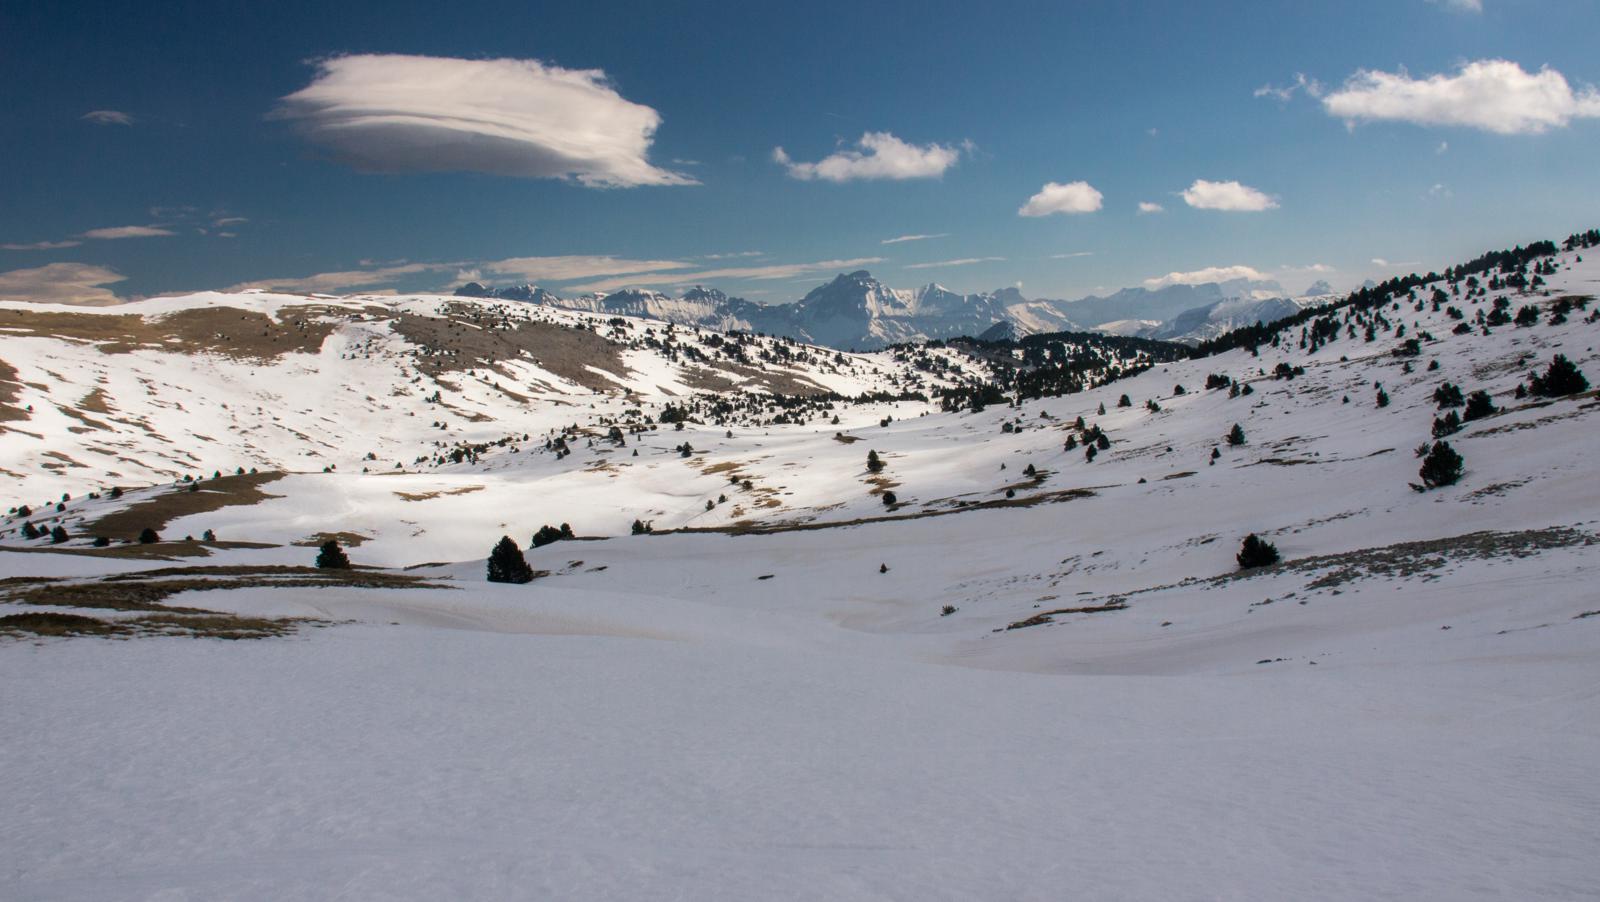
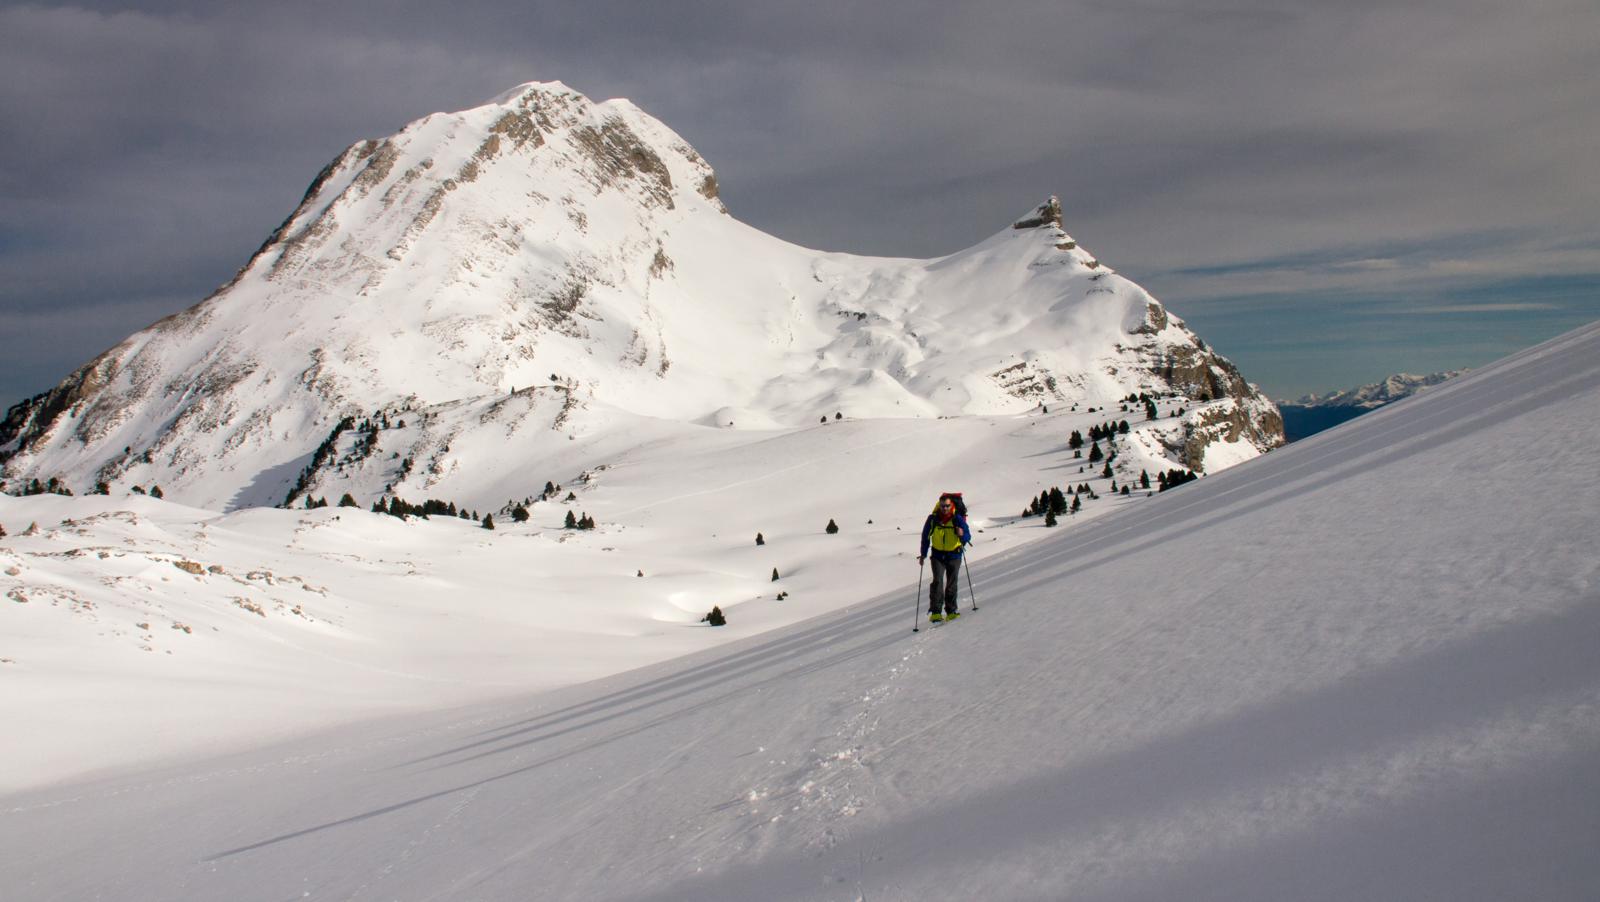
First sunrays on the Vercors Plateau, with Grand Veymont (2369m) in the centre, from the summit of Tête du Petit Jardin
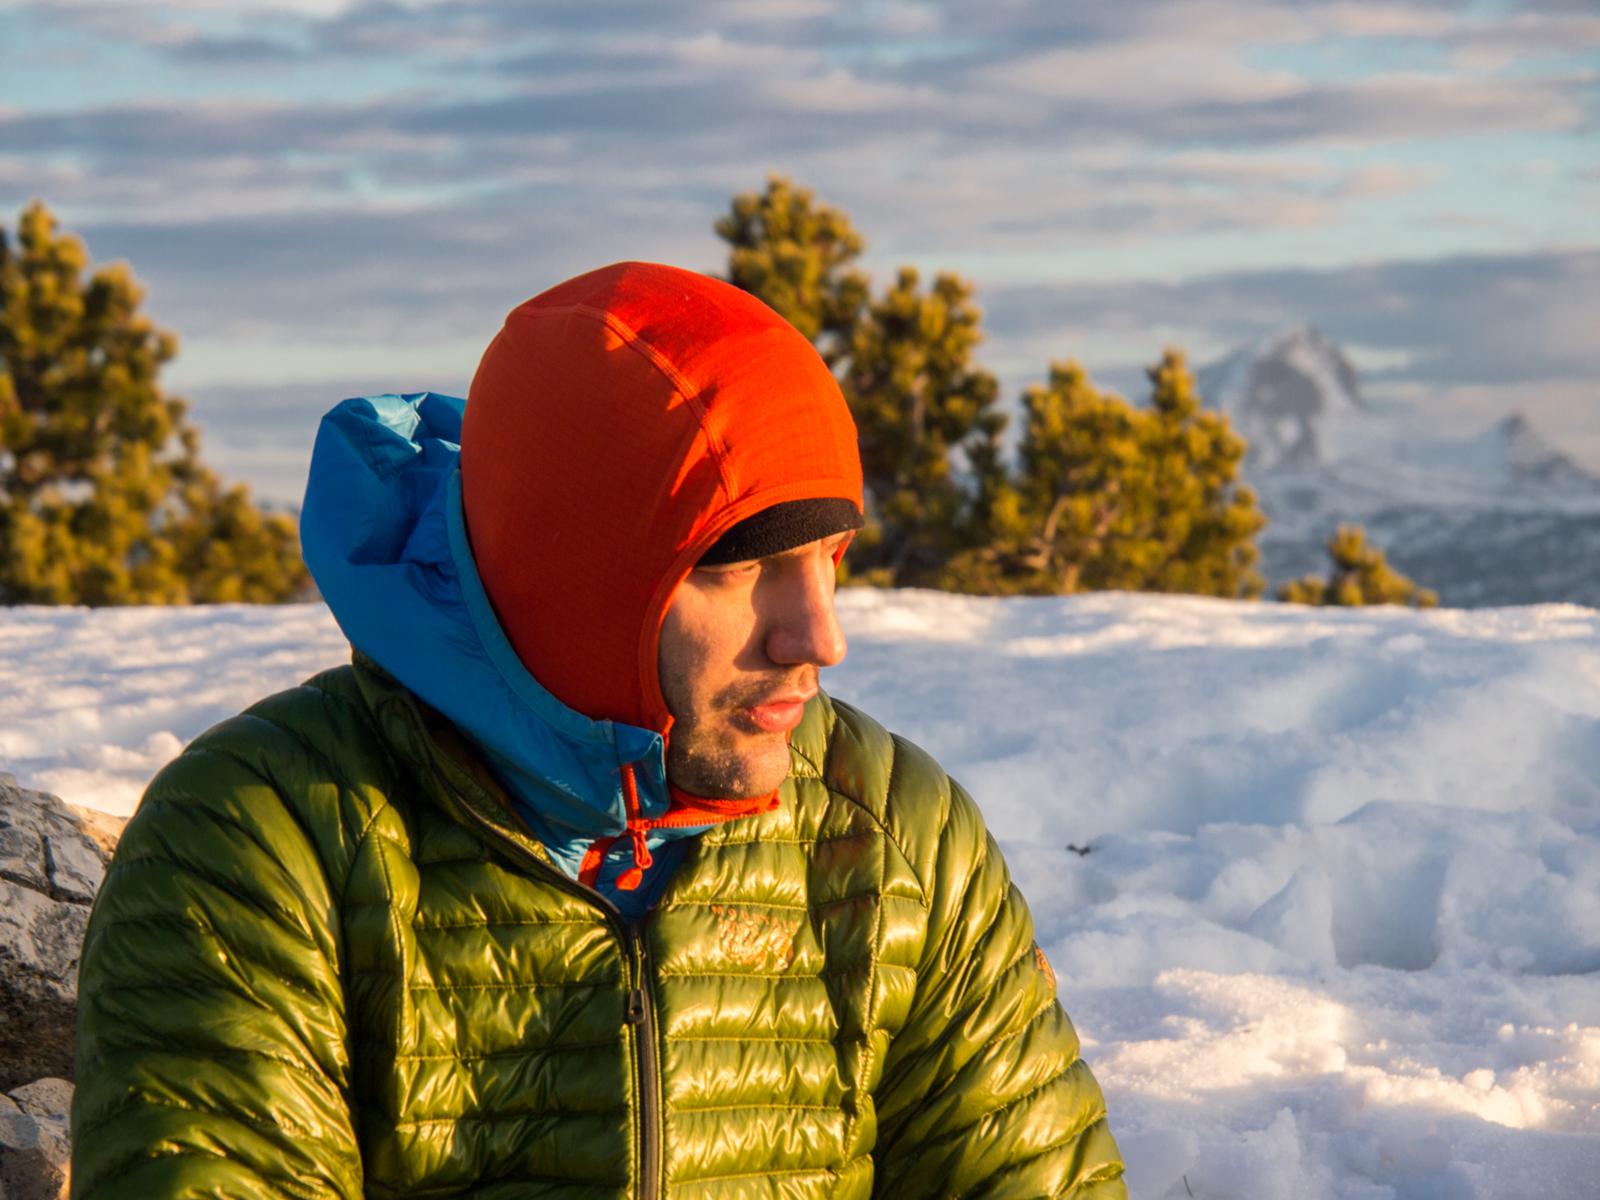
Björn on Tête du Petit Jardin
Descending from Tête du Petit Jardin
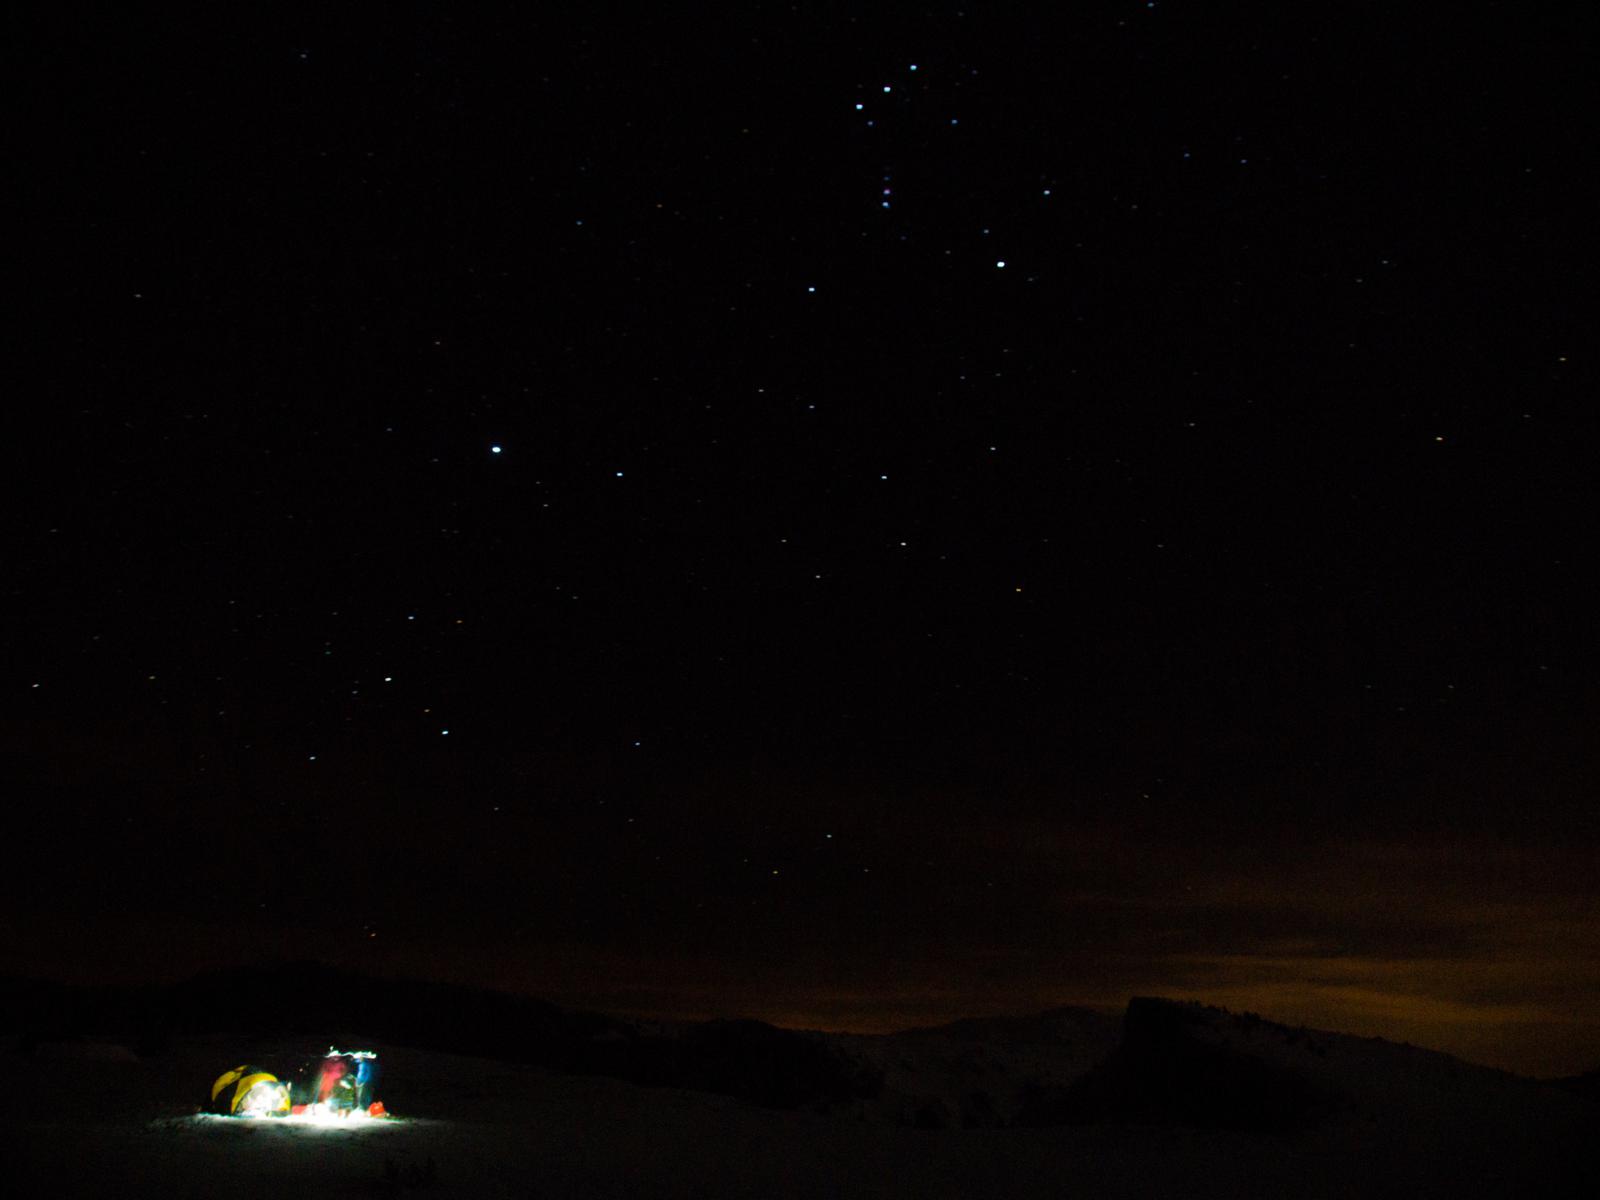
Bivy on the slopes of Tête du Petit Jardin
Bivy on the slopes of Tête du Petit Jardin
Summiting Croix du Lautaret (1972m) on a windy afternoon
From Croix du Lautaret towards Tête Chevalière
Siegried on the Tête Chevalière, with the summits of the Obiou range in the back
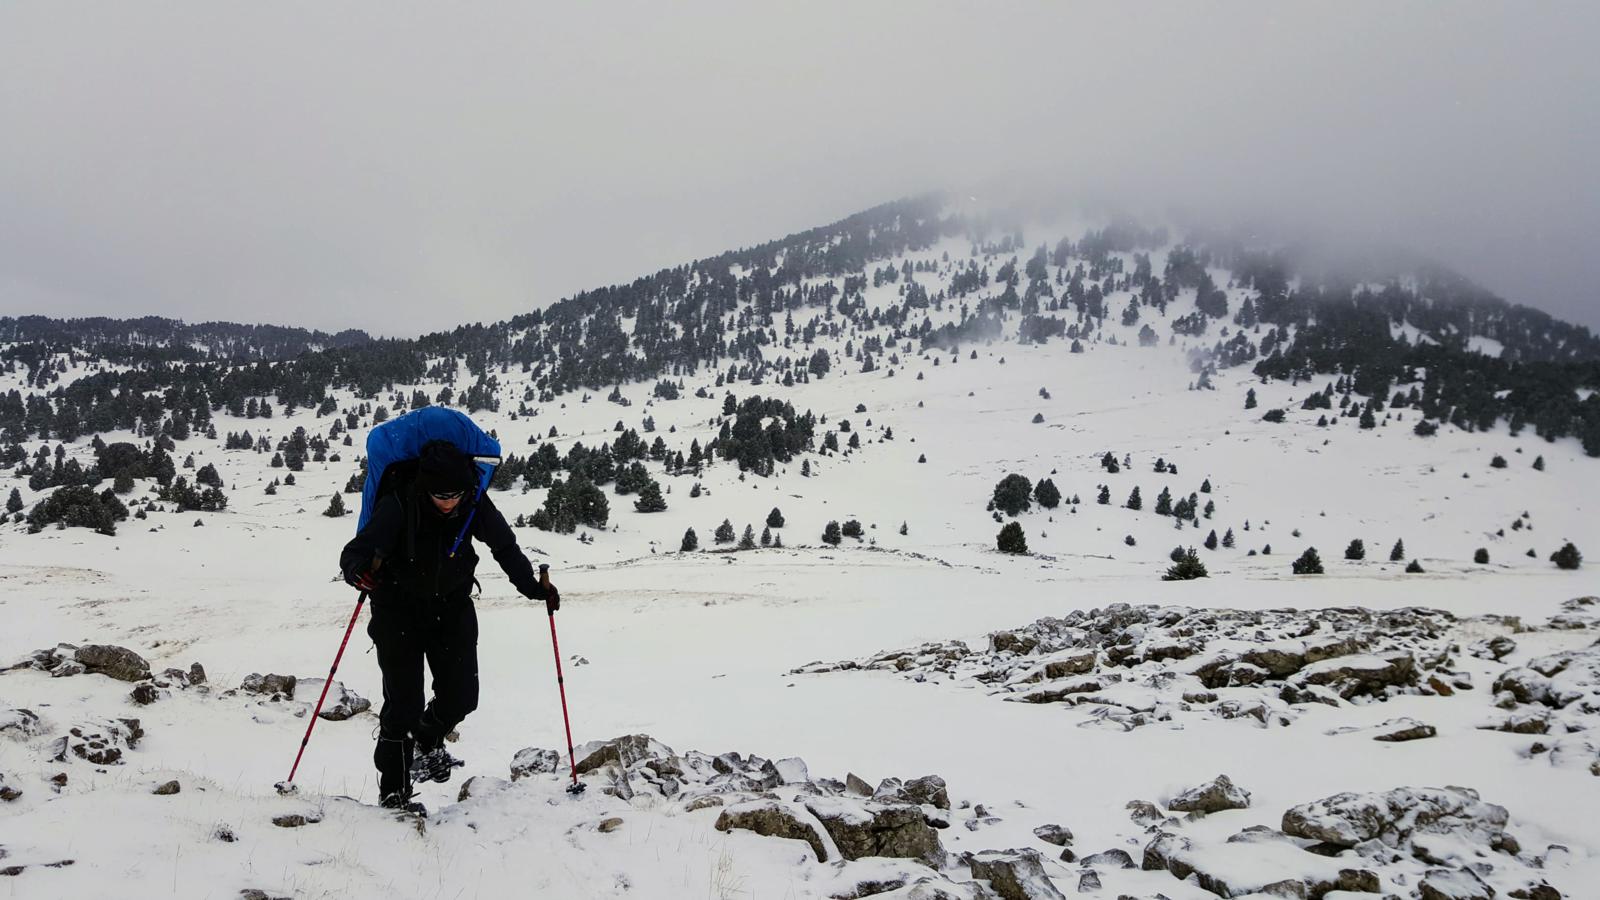
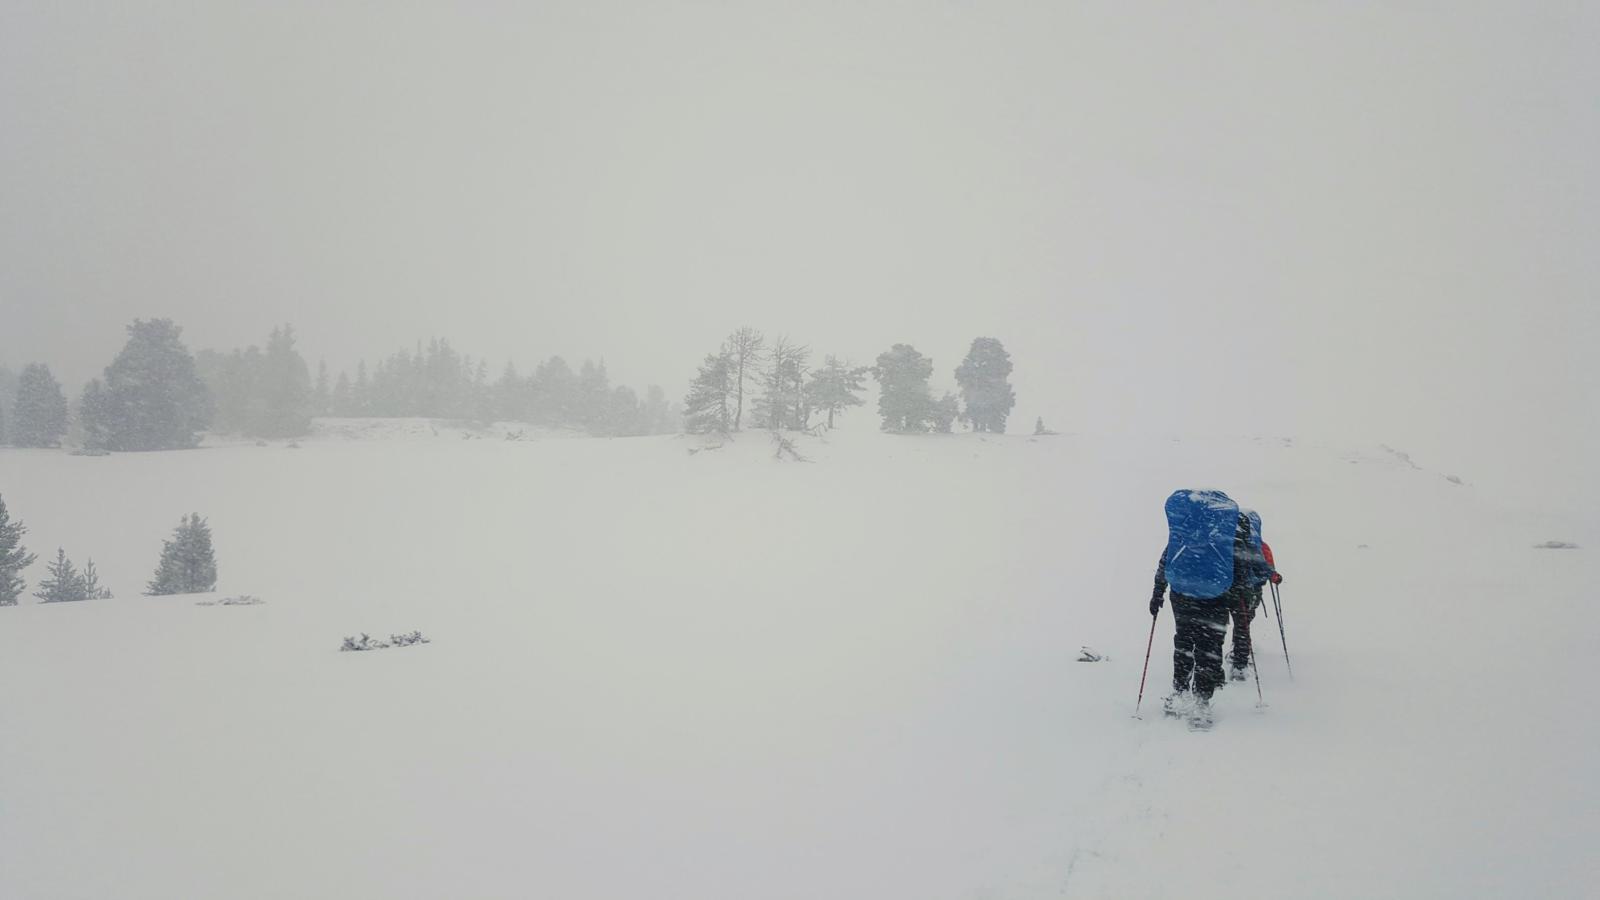
Foul weather on the way from Cabane de Chamailloux to la Grande Cabane
Foul weather on the way from Cabane de Chamailloux to la Grande Cabane
Foul weather on the way from Cabane de Chamailloux to la Grande Cabane
Foul weather on the way from Cabane de Chamailloux to la Grande Cabane
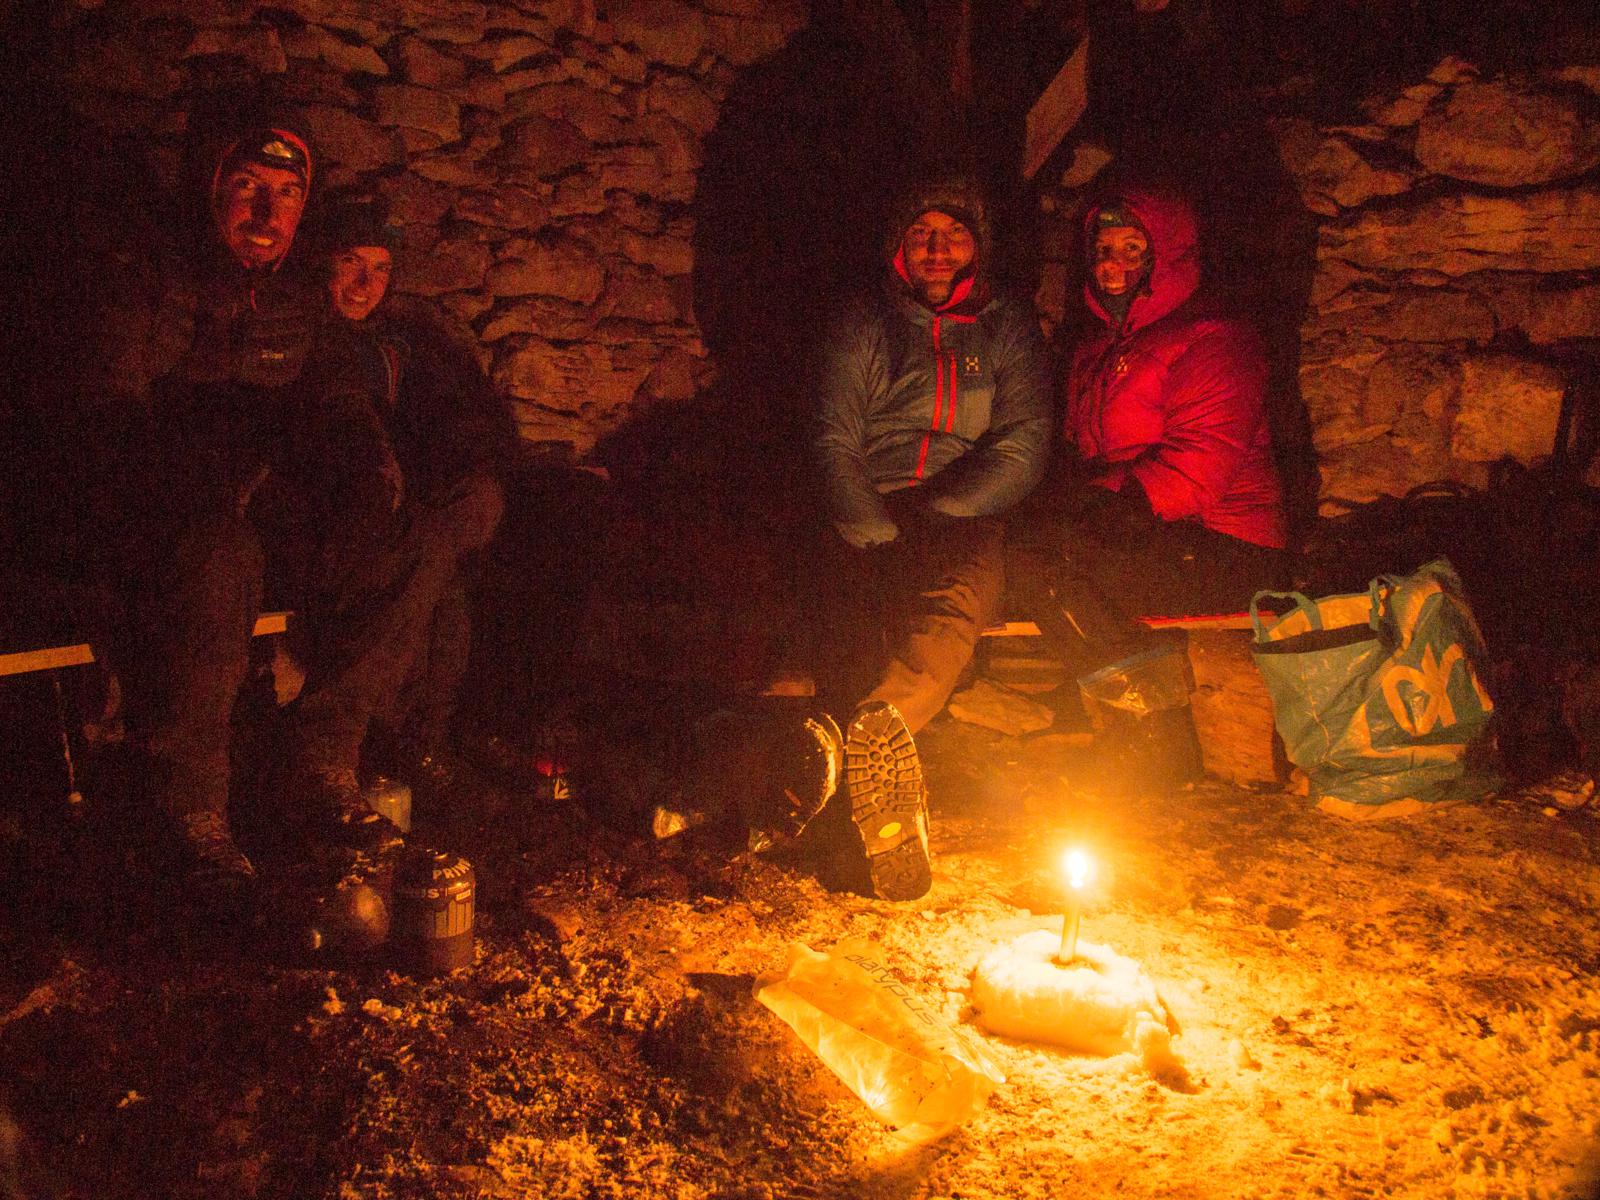
A new style of camping at la Grande Cabane
Evening at la Grande Cabane
Breakfast at La Grande Cabane
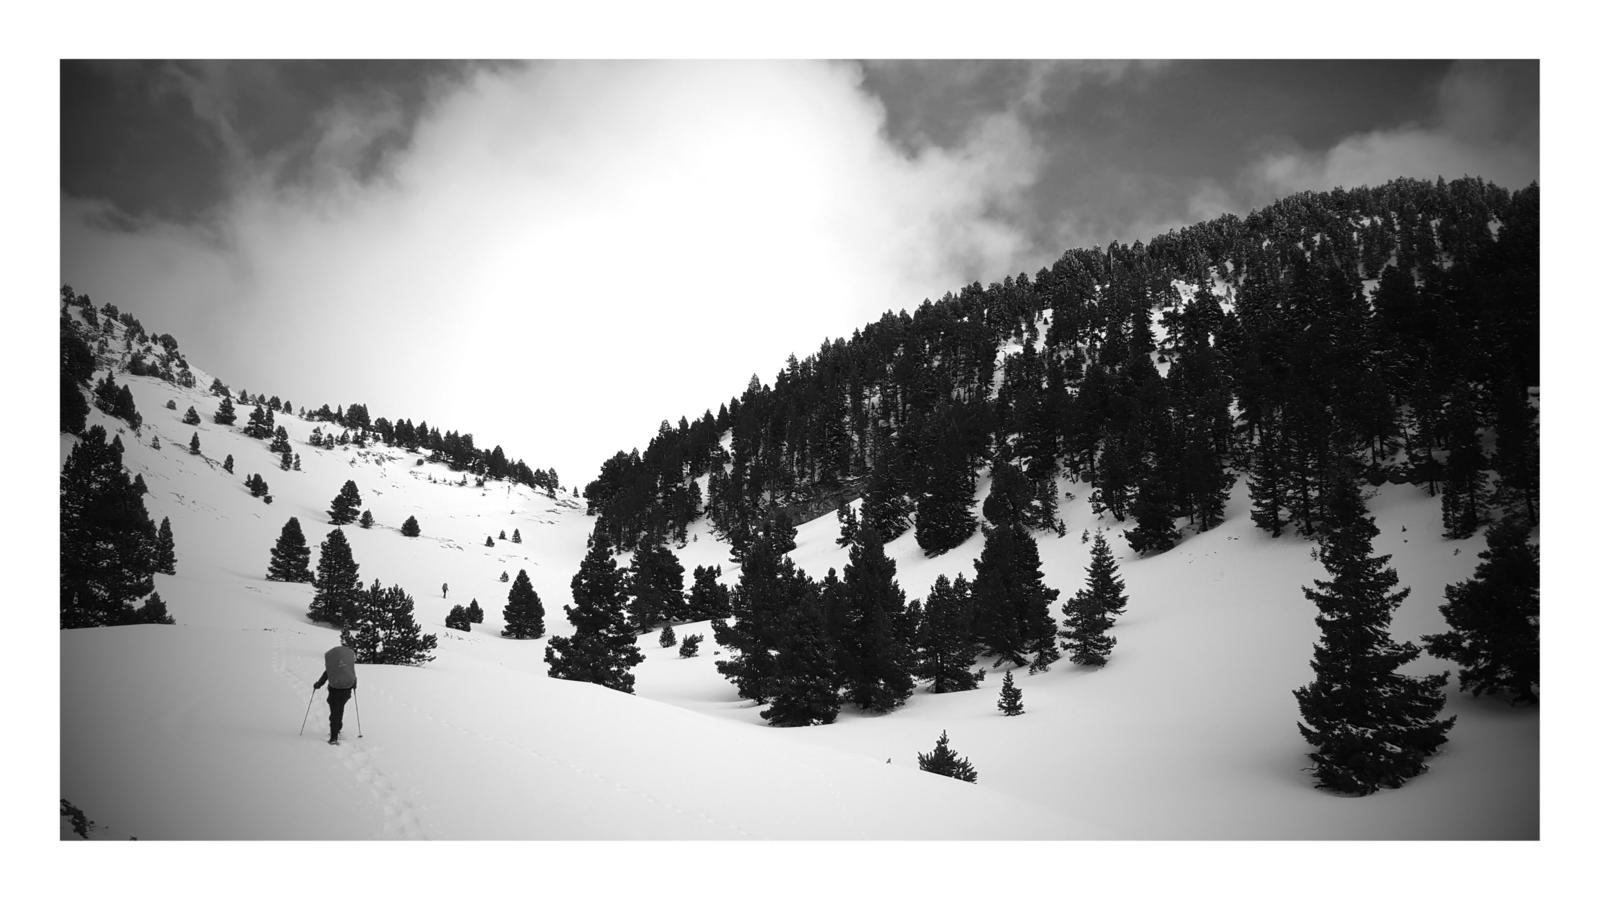
Climbing up through La Combe Verte on the way to la Jasse du Play
Get the stove going at Cabane du Jasse du Play
Climbing towards Pas de Chattons
The western slopes of Grand Veymont (2369m)
Final bivy on the beautiful plateau south of Grand Veymont (2369m)
Mont Aiguille (2087m) as seen from our bivy spot
Final bivy on the beautiful plateau south of Grand Veymont (2369m)
Final bivy on the beautiful plateau south of Grand Veymont (2369m)
Final bivy on the beautiful plateau south of Grand Veymont (2369m)
Final bivy on the beautiful plateau south of Grand Veymont (2369m)
Final bivy on the beautiful plateau south of Grand Veymont (2369m)
On the way to Plaine de la Queyrie
Descending to Plaine de la Queyrie – the weather quicky got worse with wind gust up to 90km/h by the time we reached the car – time to get out!
Overview of the route – we started/finished at Col de Rousset, about 6km off the western edge of the map
One of the most frequent questions I get in my mailbox or when giving presentations on long solo packrafting trips, during which I may have made a few first descends, is “how do you know there will what the river will look like around the corner? How do you prepare for this?”
Unfortunately, packrafting still scores headlines on outdoor websites and in the outdoor community because of serious accidents or near misses. Clearly, there will always be risks involved in paddling uncharted wilderness. But when digging into those the accident reports, it becomes clear that some could have been avoided with more serious trip planning.
I will try to briefly share my experience on trip planning in this articles. The first part will be the ‘theory’, some basic insights in river characteristics you have to master before starting to plan on wilderness trips. In the second part I will try to share some tools and methods I use to do the trip planning itself.
I am not an adrenaline junkie, and often travel through remote wilderness solo and in full autonomy. The packrafting I include during those trips is both functional (to get access to water-locked areas, and simply cover distance on long traverses) and to view and enjoy backcountry from a different perspective. I mostly paddle with a heavy pack on the bow of my raft. My knowledge and experience should always be viewed from this perspective – these articles are all about safe trip planning & solo wilderness travel on rivers up to class II – it is rather about avoiding real whitewater than about running it.
DISCLAIMER: In this articles I will try to share some personal knowledge and experience about wilderness trip planning for packrafters. Please keep in mind that even with the best preparation, there will always be dangers involved in packrafting. Experience is key for paddlers, both during trip preparation and during the descent itself – start easy and accept your own learning curve. Any packrafter holds his own responsibility for decisions made during both trip planning and on the terrain. I will not accept any liability for any accident occurring after the use of this article.
Stunning paddling on the Lower Dart River, New Zealand.
PART 1. A word about rivers
1.1. Some basic concepts
I will kick off with a few definitions of terms that will often come back while reading this article:
River discharge: the discharge of a river is the amount of water that passes through the riverbed at a certain point during a certain amount of time. It is most often expressed in m³/s or cumecs. The evolution of the discharge through time at a certain point is often displayed in discharge curves (see below). Except in some very rare cases (e.g. desert areas with extreme evaporation, like Australia’s Eyre River) the discharge will always increase as you move further downstream and the river is fed by additional tributaries.
River gradient: the river gradient gives an idea about the ‘steepness’ of a river, of its descent rate. It is expressed in m/km (or ft/mile). The higher the gradient of a river, the faster and wilder it will be. As a rule of thumb, the river gradient is high near its source and gradually decreases further down, though reality is often more complex as I will outline below.
River catchment: The catchment of a river is the area from which it drains the water (figure 1). It is separated from the catchment of another river by a watershed or divide. The characteristics of the catchment area (climate, geology, glaciers and snowfields, presence of peat bogs, lakes, soil characteristics, …) have a huge influence on the river further downstream.
Figure 1: Basic vocabulary relating to river basins
Catchment area: The catchment area is the total surface which is drained by the river. It will always increase as you move further downstream and additional tributaries join the river (figure 2).
Figure 2: Illustration of the catchment area of the Rhine River and its most important tributaries
1.2. Types of discharge curves
The evolution of the average discharge of a river throughout the year vastly depends on the characteristics of the catchment area. For clarity relating to seasonality, I will only give examples of rivers in the Northern hemisphere below. The location of the mentioned rivers is indicated on figure 3. The Rahpadno river, which is located in Northwest Sweden, is not shown on the image.
Figure 3: Location of the rivers mentioned in section 1.2
1.2.1. Meltwater-controlled rivers
Rivers which have catchments in which precipitation falls as snow during the winter months and in which glaciers may be present (e.g. most rivers draining from the Alps, Pyrenees, Rocky Mountains or in Scandinavia) show a discharge peak in spring and early summer, when snowmelt is maximal. Once most snow is gone discharge will decrease as summer continues, except when glaciers – which have a relatively stable meltwater production throughout the warmest of summer) are present in the catchment area. When temperatures drop in autumn discharge will continue to decrease, reaching a minimum during winter when most or all precipitation falls as snow – which will only start to contribute to river runoff during the next meltwater pulse in spring. A few examples of meltwater-controlled rivers with a small word are given below in the figures 4 to 6.
Figure 4: Annual discharge curve with explaining text from the Rahpadno river in Sarek National Park, Sweden (adapted from Joery Truyen – http://www.dzjow.com).
Figure 5: Annual discharge curve for the Arve river in the town of Sallanches, just downstream of Chamonix in the French Alps. A curve with a distinct peak in late spring and summer is clearly visible. Note that discharge remains high throughout summer because of the continuous supply of meltwater from the vast glaciers in the Mont Blanc Range.
Figure 6: Discharge curve for the Gave the Cauterets, which drains some of the highest ranges of the French Pyrenees. As for the Arve river in the Alps, the discharge curve is clearly meltwater-controlled, but after a sharp peak in late spring and early summer, the water levels drop rapidly as summer advances because the continous meltwater supply from glaciers is virtually absent.
1.2.2. Vegetation- and soil-controlled rivers
Rivers which have catchments mostly consisting of boreal forest (or even cultivated land) with thick, well-developed soils and with little snow cover even in winter (like many rivers in Western and Central Europe), will show an almost mirrored profile with low discharge in summer and high discharge in winter (as long as summer precipitation is not considerably higher than winter precipitation – which holds for most temperate regions on earth). The main reason for this profile is the absorption and evapotranspiration of vast quantities of water by vegetation, keeping the thick soils from getting saturated with water during the peak of the growth season – roughly from april/may until September/early November. When the growth season ends and the trees shed their leaves, the soil rapidly gets saturated with water during and after precipitation events, and river discharge will rise towards its high winter levels until the next spring. An example is given in figure 7 for the Chiers River in the Belgian/French border region.
Figure 7: Annual discharge curve for the Chiers River in the Belgian/French border region. Even though precipitation is virtually constant throughout the year, the water levels show a distinct minimum during the growth season.
1.2.3. Precipitation-controlled rivers
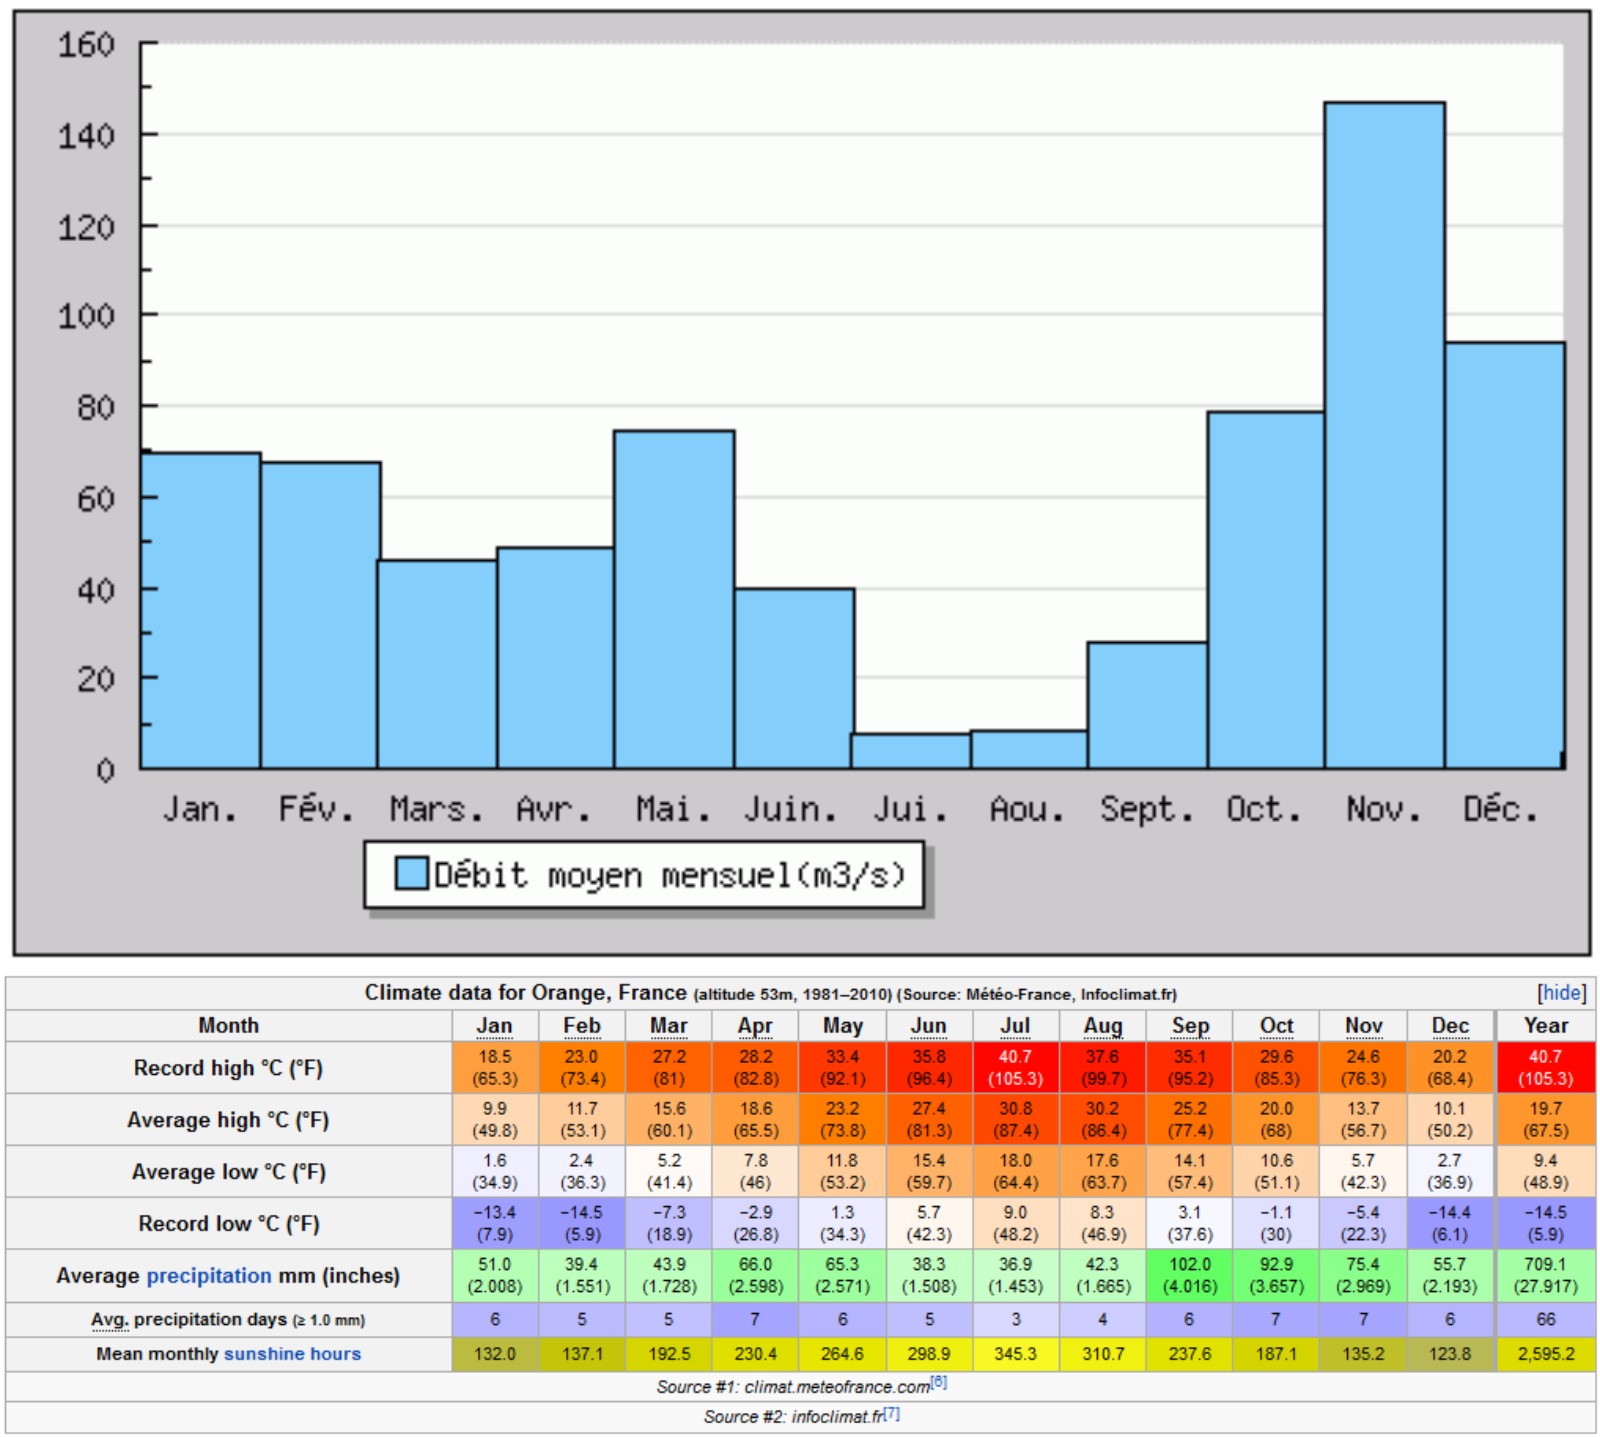
Rivers in areas with poor and thin soils and lacking a stable frost season and snow cover during winter will show a third type of discharge curve, which is mainly precipitation-controlled. This is a typical situation for many rivers in (semi-)arid and karstic regions, like various areas around the Meditterrean (e.g. Southeast France). As the meltwater pulse during spring is absent, and soils and vegetation are too poor to have the vast absorption-, buffering- and evapotranspiration capacity as in the boreal forest, river discharge will be almost directly related to precipitation.
Figure 8: Annual discharge curve for the Ardèche river in Southern France – the discharge largely track the precipitation statistics.
1.2.4. Combinations of discharge curves
The three types I have discussed above are just the end members of a vast spectrum – every river has its own specific discharge curve in relationship to catchment characteristics. The following example will make this clear:
In figure 2 we have discussed the catchment area of the Rhine River. Tributaries high in the catchment, like for example the Vorderrhein in the Swiss Alps, will yield a meltwater-controlled discharge curve. However, other tributaries like the Mosel and the Main have catchments which are mostly consisting of boreal forest and cultivated land – and therefor have vegetation- and soil-controlled discharge curves. The discharge curve of the Rhine itself downstream of such tributaries, in e.g. Köln, will be a mixture of both signatures.
1.2.5. Short-term fluctuations
The direct response of rivers and river discharge to meltwater pulses and precipitation events is also strongly variable.
– The presence of thick soils, vegetation and the lack of topography will have a significant buffering capacity – if the catchment mostly consists of such terrain the response of the river will be moderated, and slower. Example below: the Semois river in the Belgian Ardennes (figure 9)
– If soils are thin, vegetation is sparse and topographic relief katalyses runoff, the river will respond quicker and in a more extreme way. Example below: the Ardèche River in Southern France (figure 10).
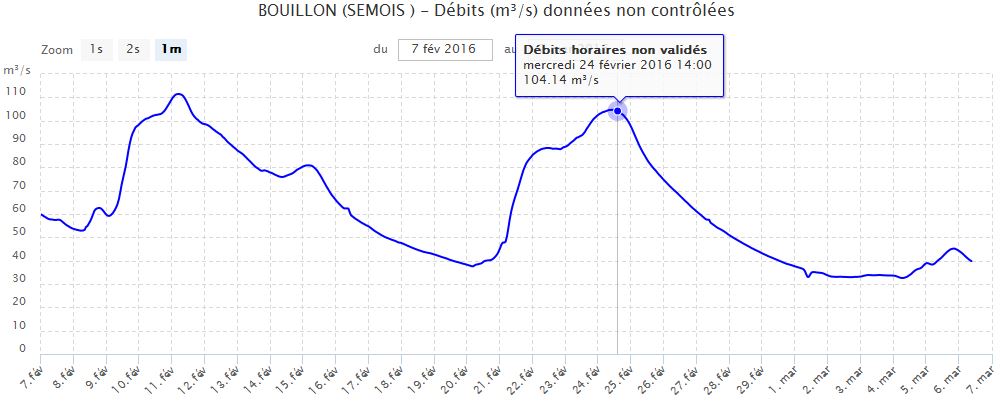
Figure 9: The response of Belgian’s Semois river (a vegetation- and soil controlled river) during a strong winter precipitation event. The increase in discharge is slow and relatively limited (discharge doubles over multiple days).
Figure 10: Discharge curve of the Ardèche River in Southern France after a strong autumn thunderstorm. The reponse of this precipitation-controlled river in a limestone area with thin soils is just scary and life threatening: the water level rises almost 9m over a matter of hours, and the discharge explodes from 10m³/s to almost 2500m³/s! A second, less severe thunderstorm the following night causes a second sharp increase.
1.3. River channel patterns
An huge variety of river and stream channel types exists – and some understanding in them is crucial in successful planning of packrafting trips on undocumented rivers. Books have been written on this subject, I will try to give just a brief overview of the most common types.
I will classify low-gradient rivers as rivers with an average flow gradient (see above) not exceeding 1,5% (15m/km). This is typically the kind of rivers I would paddle during long solo hiking/packrafting expeditions in remote areas, as they often allow to travel longer distances through scenic areas with no or very few portages and with limited risk of tipping your raft. However, a low gradient does not exclude the possibility of potentially lethal obstacles and rapids! High-gradient rivers are mostly single-channel and contain more technical whitewater. They should only be attempted by skilled paddlers with knowledge of river rescue techniques, and not by solo paddlers. I never include such rivers into my solo packrafting expeditions, and will not discuss them in detail here. Other paddlers are in a better position to do so. The text below will thus focus on the low-gradient rivers.
1.3.1. Braided rivers
Braided rivers have a channel that consists of a network of small channels separated by small and often temporary islands. Conditions associated with braided channel formation include an abundant supply of sediment (they often form in deep valleys or in the hinterland of actively eroding mountain ranges), a sufficiently high gradient, rapid and frequent variations in water discharge (precipitation events and meltwater pulses), and erodible river banks with scarce vegetation. If these conditions are not sufficiently met, a meandering or anastomosing river (see below) will form rather than a braided river.
The Rangitata River on New Zealands South Island is a classic example of a braided river – I paddled it down for a few kilometers towards Bush Creek.
The riverbed of braided rivers consists primarily of sand, gravel and small boulders. Their gradient will gradually decrease as you move further downstream. Where two braided rivers merge, the gradient downstream the confluence can roughly be estimated function of the gradient of both tributaries and their average annual discharge (or, if not available, and approximation can be made the surface of their catchment area), for example:
o River 1: Gradient of 20m/km and catchment of 500km²
o River 2: Gradient of 5m/km and catchment of 3000km²
o Resulting gradient: (500×20 + 3000×5) / 3500 = 7,2m/km
This is important to know as the character of a braided river might change when it gets fed by a high-discharge, high-gradient tributary.
I like braided rivers in my trip planning. They will often allow rapid and smooth travel in highly scenic areas. Braided rivers are predictable – because of their smooth riverbed they lack ‘unpleasant surprises’ like sudden high-class rapids. If you scout a few hundred meters before putting in, you have a very good idea of what to expect further downstream. Whirlpools and boilers might form where major channels flow together. Log jams are rare (but not inexistent) in major braided rivers, they get swept away during floods.
The main danger of braided rivers, especially when travelling solo, is that there is a serious risk that you loose you raft, gear and/or paddle when tipping over. Braided rivers are often fast, and because of the absence of eddies, bedrock features, and vegetation your raft might travel a very long distance downstream. You might also find yourself trapped on islands. Therefore, when travelling solo in remote areas, I only paddle braided rivers where the risk of tipping is absolutely minimal.
Braided rivers are very common in many areas in Alaska and Canada, Greenland, Central Asia, Patagonia, New Zealand, as well as in many other actively eroding mountain ranges around the world.
Figure 11: Satellite image of the Isortoq River in Greenland, a classic example of a braided river
1.3.2. Anastomosing rivers
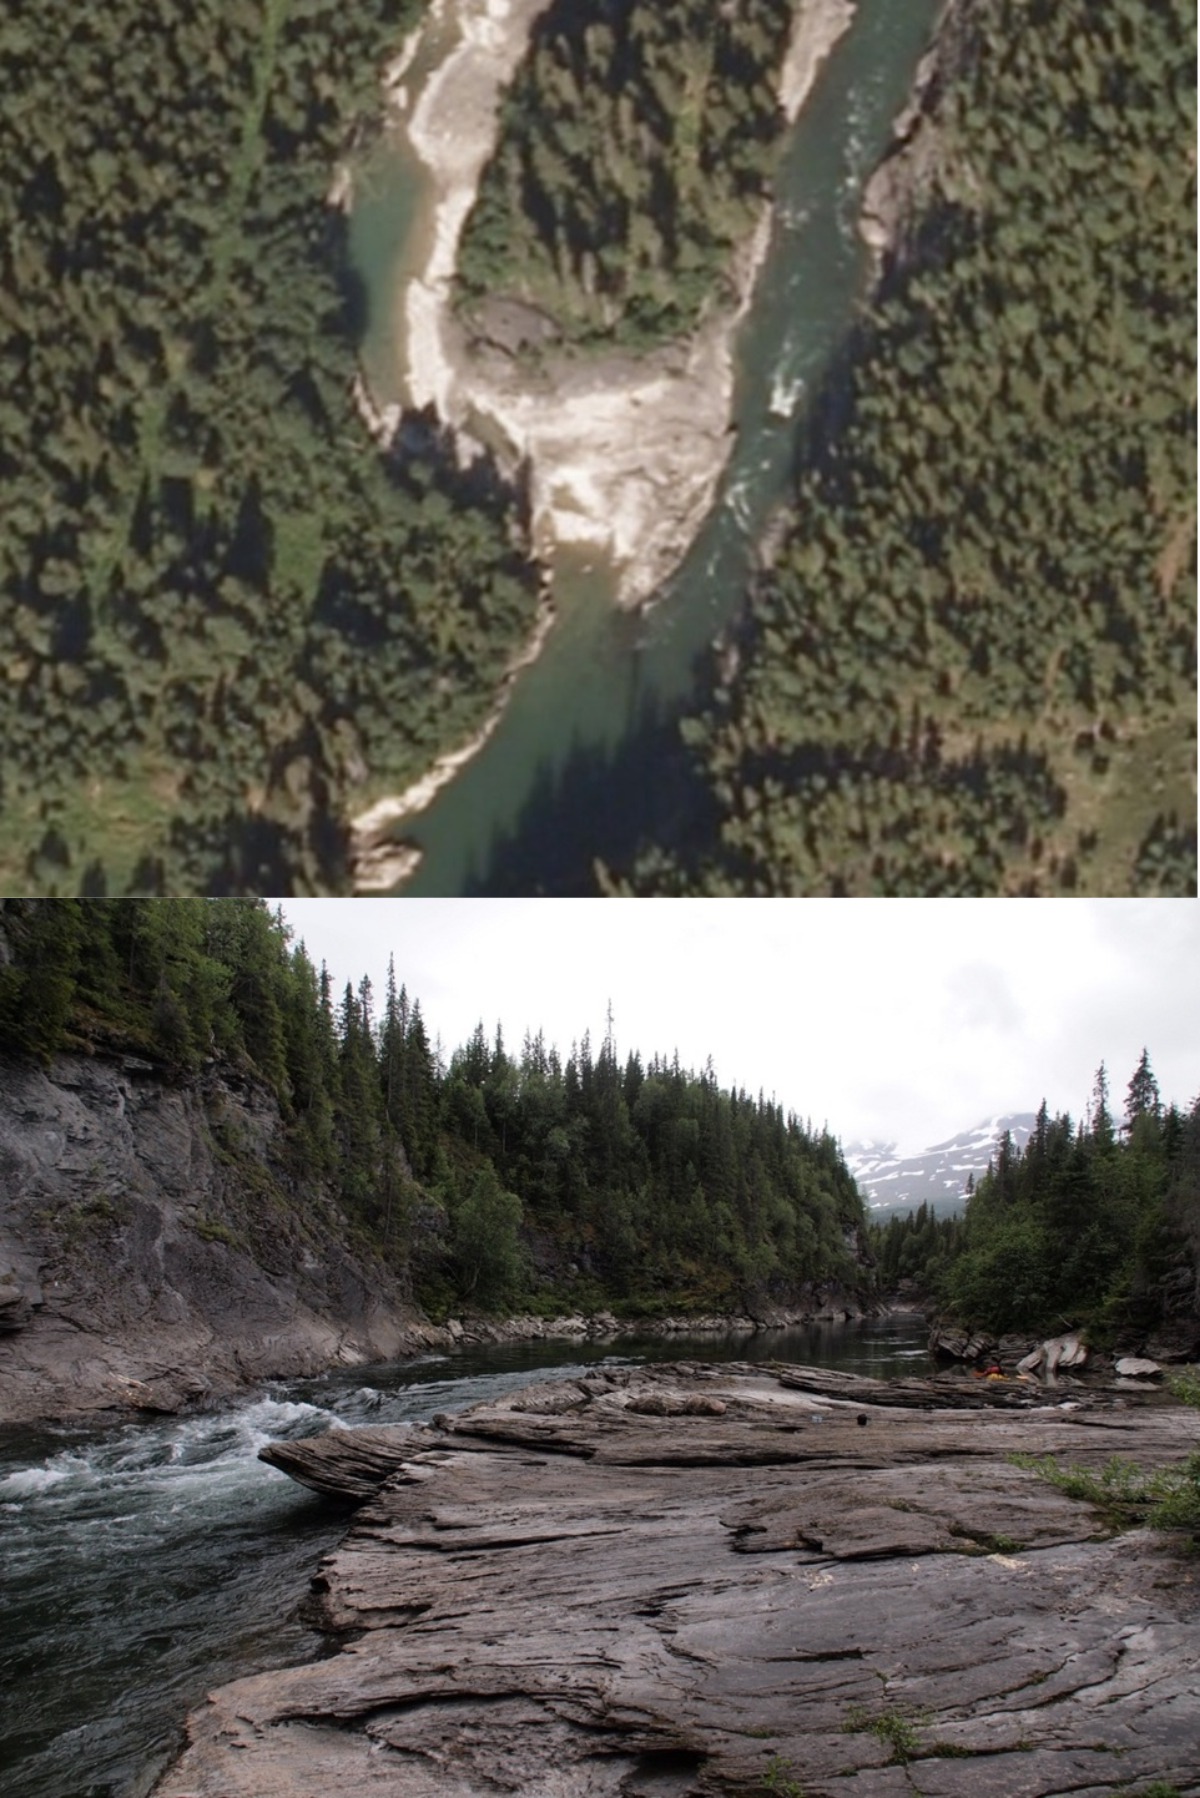
Anastomosing rivers or streams are similar to braided rivers in that they consist of multiple interweaving channels. However, anastomosing rivers typically consist of a network of low-gradient, narrow, deep channels with stable banks, in contrast to braided rivers, which form on steeper gradients and display less bank stability. The rules of thumb relating to gradient, discharge, safety and trip planning and roughly equivalent to those I outlined above for braided rivers. However, anastomosing rivers are generally slower than braided rivers, with distinct rapids separating flat sections. Furthermore, and as river banks are far more vegetated, your raft will likely get trapped somewhere during its travel downstream should you fall out and loose it. A classic European example of an anastomosing river is the lower Rahpadno River in Sarek National Park, Sweden (figure 12).
Figure 12: The Rapaselet section of the Rahpadno River in Sarek National Park, Sweden – a classic European example of an anastomosing river. (picture: Joery Truyen – http://www.dzjow.com)
1.3.3. Meandering rivers
Meandering rivers in U-shaped valleys or plains occur when supply of sediment and river gradient are low, and river banks are stable and often densely vegetated. Such meandering rivers are often slow and easy to paddle, although odd rapids may occur near local bedrock features. A fantastic example of such a high-latitude meandering river is the Alatna River in Alaska’s Brooks Range.
Figure 13: The Alatna River in Gates of the Arctic National Park, a fantastic example of a meandering backcountry river with anastomosing sections. (Picture: http://www.walldevil.com)
1.3.4. Single channel bedrock rivers
A last main category is what I will call ‘single channel bedrock rivers’, still a very generalist term for a wide variety of channel types (which could also include rock gardens or sediment substrates). As the name says, those rivers have in common that they are single channel, and their flow morphology is far more variable and highly dependent on bedrock morphology along their course. Such bedrock features imply more varied paddling, with the possibility of technical rapids and whitewater, boilers and whirlpools even in rivers which have a low overall gradient. This is especially true for high-discharge rivers which move through gorges and canyons. Log jams are very common in forested areas. Single channel bedrock rivers occur anywhere in the world and require extensive trip planning if you want to paddle uncharted rivers, both in terms of rapids and in terms of potential take out locations for scouting and/or portaging (for example, it might not be able to take out and portage once you have entered into steep gorges and canyons). An example is given below in Joery Truyen’s video from his Peel & Hart river expedition in the Canadian Yukon area – check out what happens at 2:03 in a high volume, but relatively low-gradient bedrock section!
1.3.5. Alternation of channel types
Obviously, a stream will not have one single channel type all the way from its source down to the sea or its confluence with another stream. As a rule of thumb, the gradient of a river will gradually decrease the further you move downstream; high gradient channels will thus mainly occur high in the catchment area.
However, reality is not as simple as that. Many rivers show alternations between different channel types; an example is given below in figure 14 for the Rangitata River in New Zealand, which flows from northwest to southeast through the satellite picture. After a fast but technically easy 60km braided section (gradient approx. 2.5m/km at the lower end) which ends in the northwest corner of the picture, the Rangitata picks up speeds and increases gradient as it starts cutting through a gorge as a single-channel bedrock river with class II-III rapids and two class IV rapids (average gradient approx. 8m/km over the length of the gorge), and finally emerges as an anastomosing/meandering river with distinct class I-II rapids separated by flatwater sections (gradient approx. 3-4m/km).
Figure 14: Satellite picture of the Mid-Rangitata river on New Zealands South Island. The river flows through the picture from Northwest to Southeast, going through (i) a braided section; (ii) a single channel bedrock section; (iii) a anastomosing section.
PART 2. Trip planning for backcountry paddlers
In the first part of this article, we have learned some basic concepts about river characteristics you have to master before starting to plan on wilderness trips. In this second part I will try to share some tools and methods I use to do the trip planning itself.
Planning a packrafting trip, either a paddle down a well-known rivers or a (first) descent in uncharted areas, has never been as easy as it is today. Trip reports are widely available on the internet, and topographic maps become ever more detailed. But by far the largest revolution in wilderness trip planning has been the availability of highly detailed satellite pictures (e.g. Google Earth) to end users nipping their Sunday coffee like you and me. Any river on earth is now just a few clicks away – which is just simply incredible to me. It would be dumb not to use such a detailed and accurate information to minimize the chance of accidents, and get the very best out of your trips.
2.1. Step 1: Characterization of the river and estimating river discharge
First things first – let’s first try to make a quick characterization of the river. Can I find any river guide of trip report? Is it braided or meandering? Are there any single channel bedrock stretches? Are there possibilities to skip stretches or even the entire paddling section by hiking roads or trails in case conditions do turn out to be bad on the terrain?
One of the most difficult questions at this point is to estimate whether or not a river will have enough water to paddle it when you are travelling higher in the catchment. During my first long hiking/packrafting traverse, 2750km through Scandinavia in 2012, I sometimes looked forward to paddling a scenic river for days, only to find out I was just bumping from rock to rock once I got there – and eventually had to walk the sections because of low water levels. Making this discharge estimate is something which gets easier with increasing experience – but is still one of the hardest parameters of wilderness packrafting to assess.
As outlined above – the discharge of a river will mainly be function of (i) annual and seasonal precipitation in the catchment area; (ii) meltwater supply; (iii) vegetation and soil characteristics. You should first classify your rivers somewhere between the three annual discharge curve end members outlined in the first part of the article. A river in an arid mountainous region without glaciers will probably be impossible to paddle late in summer, whereas a stream in the same area with a far smaller catchment but including glaciers might still offer fine conditions.
Another thing you might consider is trying to find pictures, trip reports or a river guide for comparable, nearby rivers with similar catchment characteristics (and during the same time of the year) – I will give you a good idea of what you might expect in terms of water levels, even if the gradient is different.
2.2. Step 2: Estimating river gradient – making an altitude profile
The next step in your planning will be to make an estimate of the river gradient. For backcountry rivers, there are two ways to do so: by topographic maps and by satellite pictures. I will use Sweden’s Rahpadno River in Sarek National Park as an example: it is a remote wilderness river with an alternation of braided, anastomosing and single channel sections (with an odd single channel bedrock section); topographic maps are of reasonable quality but not very detailed (1/100000 scale) and high resolution satellite pictures are available. The annual discharge curve is meltwater-controlled.
2.2.1 Method 1: Topographic maps
Sweden’s mountain areas have been mapped in reasonable detail in the 1/100000 ‘Fjällkarten’ Series. The main setback of these maps is that the contour lines, which have a 20m interval, have been smoothed, often impeding map reading for hiking in terms of small gorges and canyons of side streams. However, this is of minor importance for river planning of low-gradient rivers.
This is how to calculate river gradient from topographic maps:
– Search for points with known altitude along the river. Mostly this is the intersection of the river with a contour line, but it might for example also be the inflow/outflow of the river in/out of a lake.
– Measure the distance along the main channel of the river between those points with known altitude.
– From the altitude difference and the along-river distance you can calculate the gradient between two or more of such points: for example if the river descends from 1050m to 1025m over a 6.4km interval, the average gradient over this stretch is 3.9m/km.
An example is given in figure 15 for Sarek’s Rahpahndo river – with a short word on it in the image caption.
One should always keep in mind that this method only will tell you something about average gradients over a certain distance. If a river drops 20m over a 5km interval (a modest 4m/km gradient), this theoretically does not rule out the possibility of a deadly 18m drop somewhere on the way, all the rest being virtually flatwater. It should therefore be viewed as a tool to get an estimate whether or not most of the river will be possible to paddle and look like. Individual river features should always be mapped in detail and approached with care, as I will discuss in section 2.3.
Figure 15: River profile for Sweden’s Rahpadno River based on the 1/100000 Fjällkartan maps. By indicating every point along the river with a known altitude (intersections with contour lines, lakes, ponds connected to the river) and clicking their distance downstream, I quickly produced a profile through a Scatter plot in Microsoft Excel. It can clearly be seen that the braided and anastomosing parts on the river have a low gradient, whilst gradient on the single channel (bedrock) parts (near Laddabakte and Gadokvarasj) is high.
2.2.2. Method 2: Google Earth
A second, quicker method to make an estimate of the river gradient is directly through Google Earth. To do so, click a path on the (main channel of the) river you want to descend, and display the altitude profile of it once you’re done. Zoom in sufficiently, the resolution of the displayed profile will improve while you do so. The example of the Rahpadno river is again given below. Compare it with the curve we generated from the map.
Figure 16: River profile for the Rahpadno River as generated with Google Earth. By selecting a part of the clicked track, you can directly derive gradient information for part of the river.
Mapping river profiles with Google Earth has a few advantages:
– It is much faster in the first place
– In theory, if the digital terrain/surface model behind the satellite picture has a high resolution (see below), the profile will show more detail than the one generated from a map as altitude/distance information is continuous, and not only derived from just those few points where the river intersects with a contour line.
However, things are often more complicated then we would like… as mentioned above, the altitude information in Google Earth is based on a Digital Terrain Model (DTM) or Digital Surface Model (DSM). Every DTM and DSM has a certain horizontal and vertical resolution – the higher the resolution, the better your river profile will look like.
– A bad vertical resolution will match erroneous altitude data to your picked track – for example, when the vertical resolution is 20m, a location with a real altitude of 463m might be plotted at any altitude between 453m and 473m in your profile.
– When horizontal resolution is insufficient, the deepest part of the valley will not match the location of the river in the DTM. When you map the profile of the river by clicking it, this will lead to weird bumpy profiles – especially in deep, steep valleys and canyons, but for example also in regions where rivers cut through moraine of steep terraces. An clear example is given in figure 16, where the Verdon river in Southeast France cuts through a deep canyon. In plains or wide valleys (like is the case for many wide braided or anastomosing rivers) a low horizontal resolution on itself does not need to be a major problem.
Figure 17: Oblique Google Earth image for the Verdon River in its canyon in Southern France – because of insufficient horizontal resolution the river plots on the canyon walls. Generating a river profile through Google Earth will yield highly unreliable results.
I have not found reliable sources on this, but it looks like Google is using DTM’s and DSM’s with a resolution which is highly variable depending on the location.
By picking a track, you will get pretty reliable profiles for many rivers, especially in wide valleys where horizontal resolution is of less importance (the Rahpadno is a good example). In such areas, the DSM/DTM has a high resolution.
However, the profiles you will generate can also be worthless (for example New Zealands Rangitata River I discussed in the first part, see figure). This is the case in areas with low resolution DSM/DTM.
As a rule of thumb, a profile is reliable if you get a smooth curve which seems to reflect the visual characteristics of the river (alternation of braided, anastomosing and single channel sections for the Rahpadno example). If the profile looks very bumpy (like for the Rangitata) you better not use it.
Figure 18: River profile of the mid-Rangitata on New Zealands South Island as generated through Google Earth. Due to highly insufficient horizontal and vertical resolution of the DSM/DTM used by Google in this area, the generated profile is very bumpy and should not be used for trip planning. A profile based on topographic maps will yield better results.
2.2.3. Which gradient can I paddle down?
We have now learned how to make the best altitude profile we can based on just maps and satellite imagery. Another crucial question remains: what gradient can I safely paddle down? What gradient matches which technical level of the riveré? Once again, this is something you will largely learn by experience. There are so many factors influencing the technical character of a river, the main ones being the river channel pattern and the discharge. Most rivers will become faster and more technical when discharge increases. A high-discharge river with a gradient of 10m/km will be more technical and require better boat handling skills than a low-discharge river with the same gradient.
As outlined above, braided rivers will have a very smooth gradient, and are highly predictable – they lack sudden high-class technical rapids. I will therefore be confident to include low-discharge braided rivers with gradients up to 15m/km in my planning – and a bit less (maybe 4-10m/km) for braided rivers with higher discharges. The most powerful braided river I ever paddled was the mighty Tasman River draining New Zealands’s Mount Cook Range – it had a gradient of roughly 5m/km and I felt safe solo and without drysuit. A single channel bedrock river with the same discharge and gradient would certainly contain powerful rapids and vigorous boilers and whirlpools – paddling such a high-volume river will require far more planning and regular scouting and portage on a solo expedition – have a look at Joery’s video from Patagonia Joery’s video from Patagonia. The first 4 minutes contain shots from the Rio Baker, an extremely high-discharge river with an average gradient of less than 1m/km over the distance he paddled it, but which still contains potentially lethal rapids.
Anastomosing rivers and meandering rivers which lack bedrock rapids will – other than braided rivers – often show more distinct rapids separated by flatwater sections, but they mostly lack the technical rapids of single channel bedrock rivers.
2.3. Step 3: Mapping the river
The last step in preparing your river descent is mapping individual river features, potentially dangerous sections, and possibilities for scouting and portage. This part of my preparation is based entirely on Google Earth imagery, which has now a sufficiently high resolution for many remote areas in the world. When resolution is too low, it might be worth looking at aerial photography and satellite imagery offered by National Topographical Institutes, which is also often available for free.
When using Google Earth imagery for trip planning, a few factors might impede easy interpretation:
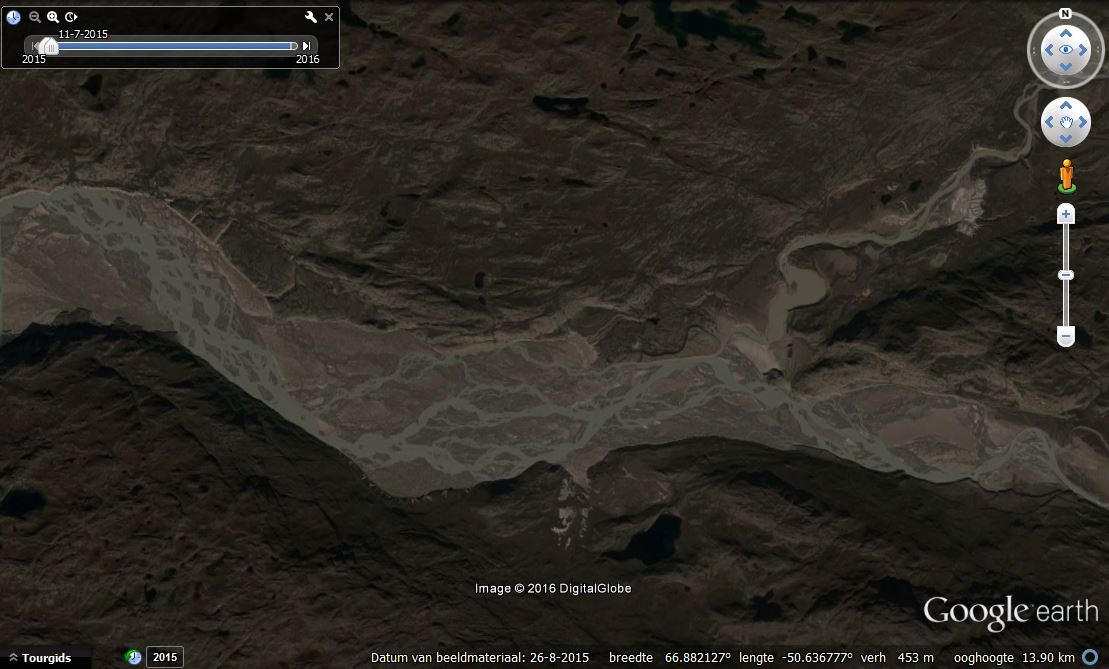
– The images you are using might not reflect the conditions on the river as you will encounter them – for example, we you want to descend a meltwater-controlled river in autumn and you are using pictures taken in spring, the river will have more water and look wilder on the image than how you will find it. The date a Google Earth picture was taken is displayed at the bottom of your screen (see figure 19). For many areas, multiple pictures are available – you can scroll through them using the timeline symbol at the top of your screen (see figure 19). You might be able to find more relevant imagery like this.
– Even is your Google Earth picture was taken in the right time of the year, recent precipitation events might blur the ‘real’ look of the river. This is hard to estimate – a murky water color compared to other pictures you find through the timeline might give an indication about this.
– In mountainous areas and canyons, part of the river might be located in the shadow, which will make interpretation of the images much more difficult.
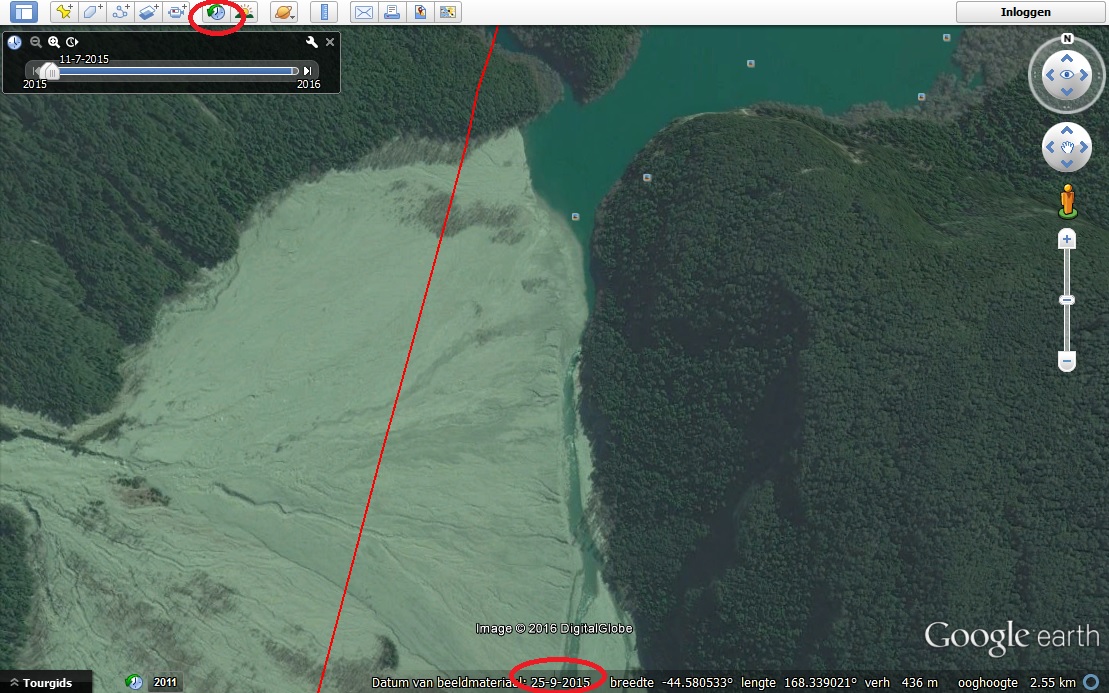
– Finally, (low) sun can cause reflections on the water which impede interpretation (figure 20).
Figure 19: Satallite image for the Dart River on New Zealands South island – with indication of the image date and the timeline symbol which allows you to scroll through historic images.
Figure 20: Satellite image of the Waiau River, connecting the Te Anau and Manapouri lakes on New Zealands South Islands. Low sun causes strong reflections on the river, making interpretation from this image virtually impossible.
Once you have found the right picture for the stretch you want to paddle, you can start to scan it for individual features.
Rapids appear surprisingly well on satellite imagery as whitewater and waves. When scrolling through the satellite imagery, I indicate all rapids I can find on the map I will take with me while rafting, giving them a ‘color code’ depending on how strong or dangerous they look. In my personal code there are three colors: (i) a yellow rapid is a rapid I notice on the satellite imagery, but where I do not expect any problems during the paddling, and which I will highly likely be able to go down without any scouting or whatsoever; (ii) an orange rapid looks stronger – I will approach it with care and scout/portage if that feels necessary; (iii) a red rapid is a rapid which looks potentially dangerous or just impossible based on my satellite pictures – I will always take out and scout it, and portage if necessary – even if it looks easy on approach on the terrain.
For the rapids I mark in orange and red, I also have a look at the potential locations of take-out and put-in upstream and downstream the rapid. Be aware that it might be necessary to take out a longer distance before the rapid – for example in steep valleys. In gorges and canyons, it may be impossible to take out and scout or portage altogether – in such cases you should be prepared to just portage whenever you are in doubt a rapid will be safe to run with your paddling capacities.
A few examples are given below in the figures 21-25.
By mapping all rapids an potential obstacles on the river, you will eventually produce a river map (figure 26) which I attach to my backpack/bowbag on the bow of my raft while paddling (figure 28) – by attentively following my progress on the map I always know when a potentially dangerous section is coming and when I should be prepared to take out for scouting or portage.
Figure 21: a minor rapid on Belgium’s Semois River – typically the kind of rapid I’m sure I will be able to paddle without the least risk of capsizing. I would indicated in yellow on my river map.
Figure 22: a rapid in Central Norway’s Susendalen valley on a river I paddled during my Scandinavia traverse in 2012. The river is flowing from south to north through the sat pic; and you can clearly recognize a bedrock rapid. I indicated this rapid in orange on my river map. On the sat pic, I could also see a very nice place to take out on the left bank just before the rapid and go scouting. On the picture you can see my raft on this spot, while I’m scouting the rapid once I made it there on the terrain.
Figure 23: A long rapids on bedrock on boulders on the Western Matukituki River in Mount Aspiring National Park, New Zealand. I indicated this rapid in red in my trip planning. The picture is taken from the suspension bridge which is indicated on the sat pic.
Figure 24: On this satellite image from the Dart River in New Zealand I could see the river flowing through a bunch of trees – a potentially highly dangerous situation. I indicated it in red, knowing that portage would be very easy on the right bank of the river on the scree levee. On the picture you can see what it looked like in reality.
Figure 25: The Pas de Souci, a very dangerous bouldergarden on the Tarn River in Southern France. River is flowing from north to south. Portage is obligatory on this section, where the river disappears entirely between huge boulders on a couple of sections. On both the satellite picture and the image you can see the river entering the boulder garden. I clearly indicated this section in red on my river map.
Figure 26: River map for the Karasjohka river in Norway’s Finnmarksvidda, a river I paddled on a cold september day in 2012 during the last weeks of my Scandinavia traverse. This is the map I would attach to the pack on the bow of my raft while paddling.
Figure 27: Paddling down a slow section on the Tana River in extreme Northern Norway on a frosty late september morning – my river map is attached to my backpack on the bow of my raft.
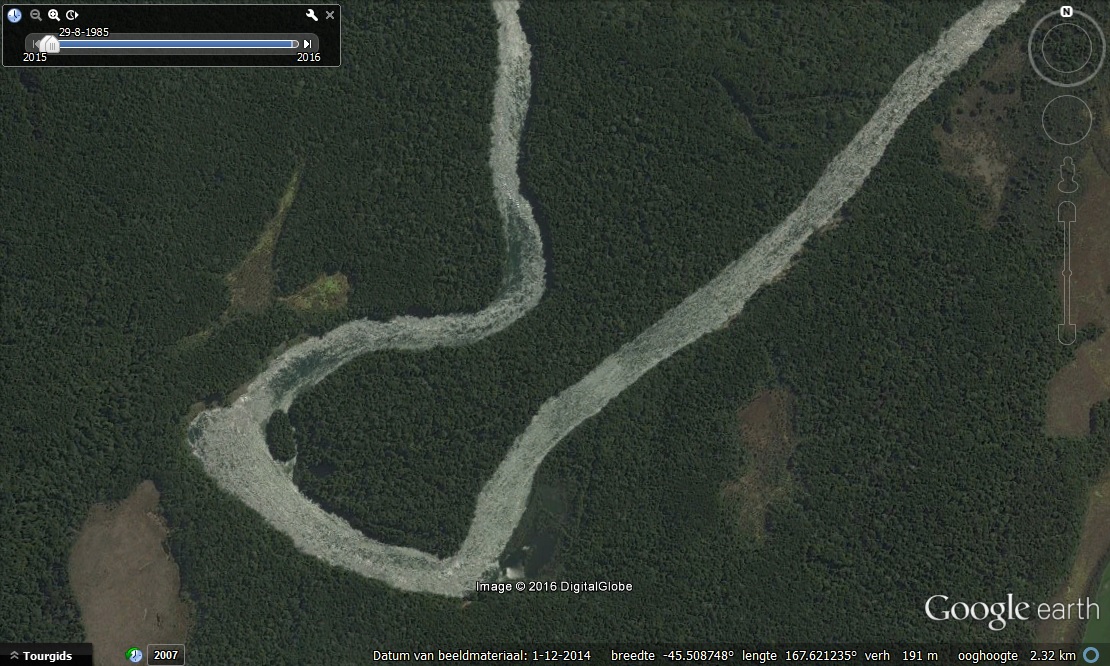
Log jams, strainers and sweepers are danger which is too often overlooked during river planning in wilderness areas. They can pose potentially lethal obstacles in any river with (part of) its catchment located below the treeline.
When high-resolution satellite imagery is available, it is often possible to locate log jams and fallen trees. However, flood events will sweep jams and trees away – this kind of obstacles are typically temporary. If you make an interpretation based on satellite imagery, you will find that many log jams have disappeared once you are on the river, and new ones have formed. Mapping log jams will therefor mainly tell you something about the probability of encountering them on the river, rather than about the exact location.
An example is given in figure 28 for a river snaking through the Taïga forest of the northern Altai mountains, near Lake Teletskoye in Siberia.
Figure 28: Satellite image of a river near Lake Teletskoye in Siberia – log jams and sweepers can clearly be noted.
2.4. Finally, a word about flatwater paddling
During most of my long solo wilderness expeditions, an important part of my paddling hours were on flatwater: lakes, fjords and even sea straits. While paddling on flatwater might sound boring for many packrafters – your maximum speed is limited to about 4.5km/hour without wind or currents – it is a crucial part of my trips to reach water- and/or glacier-locked areas which would otherwise be impossible. During my Qeqqata expedition in Southwest Greenland in summer 2016 I paddled across 9 fjords and numerous lakes to be able to cross from Kangerlussuaq to Maniitsoq and back!
Whilst paddling on flatwater is technically easy, half of the known packrafting fatalities occured on open water, always in combination with cold water temperatures. There is equally a few things to know when you consider paddling across a 3km icy fjord or on iceberg-dotted sea straits. The two main things to take into account are wind (and waves) and tidal currents.
2.4.1. Wind
When there is no wind and no tidal currents, a descent paddler will paddle at about 4.5km/hour for longer distances in a standard solo packraft like the Alpacka Yukon Yak. Flatwater paddling with headwind soon becomes hell – a 2-3 bft headwind is still feasible (although you will already be way slower), a 4 bft headwind will make you suffer big time for minimal progress and should be considered only for a short, crucial section of passage. You will also get very wet from waves breaking against the bow of your raft with the splashwater being blown into your face by the wind. A tailwind is more forgiving and will speed you up – I have paddled with 6 bft tailwinds on Lake Wanaka in New Zealand at a speed of 7-8km/h. As long as you are paddling in the same direction as the (breaking) waves they don’t need to be a big issue. Sidewinds of 4 bft or stronger can be hard both because of the difficulty not to be blown onto the lee shore, and because you are moving parallel to the crest of the waves and stability might become an issue when waves grow higher.
Changing weather conditions and increasing wind speed are the biggest danger on long flaterwater crossings. You should have a good insight in the dynamics of thermal and local winds (e.g. fjordwinds, katabatic winds, …) prior to your trip. During fine weather episodes, always paddle early in the morning, before the thermals pick up. If you get caught by increasing winds on the water, consider changing your itinerary and paddle with the wind to the shore, even if this shoreline is further away. Travelling with the wind is safer and will boost your morale, compared to the super slow progress you will make trying to battle against the elements.
2.4.1. Tidal currents
When paddling down long fjords and in sea straits, you should always check tide tables to know when the water is getting in/out the fjord so you can make sure you have the current in your back. For long fjord and sea strait crossings, it is wise to paddle shortly after the moment of high/low tide, when the tidal currents reach their minimum (although a lot also depends on local coastline morphology). It should be noted that relatively smooth paddling against the current can be possible when coastline morphology is irregular or indented – huge eddy currents will form behind capes, cliffs and islands. You will have to stroke hard though when paddling through the strongest of the tidal current when navigating around capes to make it to the next eddy. An example of such ‘tidal coastline eddies’ is visualized in a nice way be the movement of icebergs in a sea strait in Cape Farewell Country on the timelapse below in shot in summer 2013 – make sure to watch in HD and keep an eye at the icebergs near the shoreline!
Finally, it is important to know that when wind and tidal currents are in opposite direction, it will make waves shorter, higher and break faster – and way harder to paddle. Waiting a few hours until the current has changed direction can mean a huge improvement in conditions.
Well, I hope that helps planning your next trip! Please drop your questions and remarks. Happy and safe paddling in 2017!
I have ended the previous part of my report with an obligatory rest day because of high winds – at the most stupendous of places along the Eternity Fjord. After the wind drops in the evening, I am able to start the last leg of my long solo expedition the following morning: paddling to the tip of Eternity Fjord, hiking away from it through an extremely remote and spectacular valley, and then climb onto the plateaus which I will cross on the way back to Kangerlussuaq during the last days of the trip.
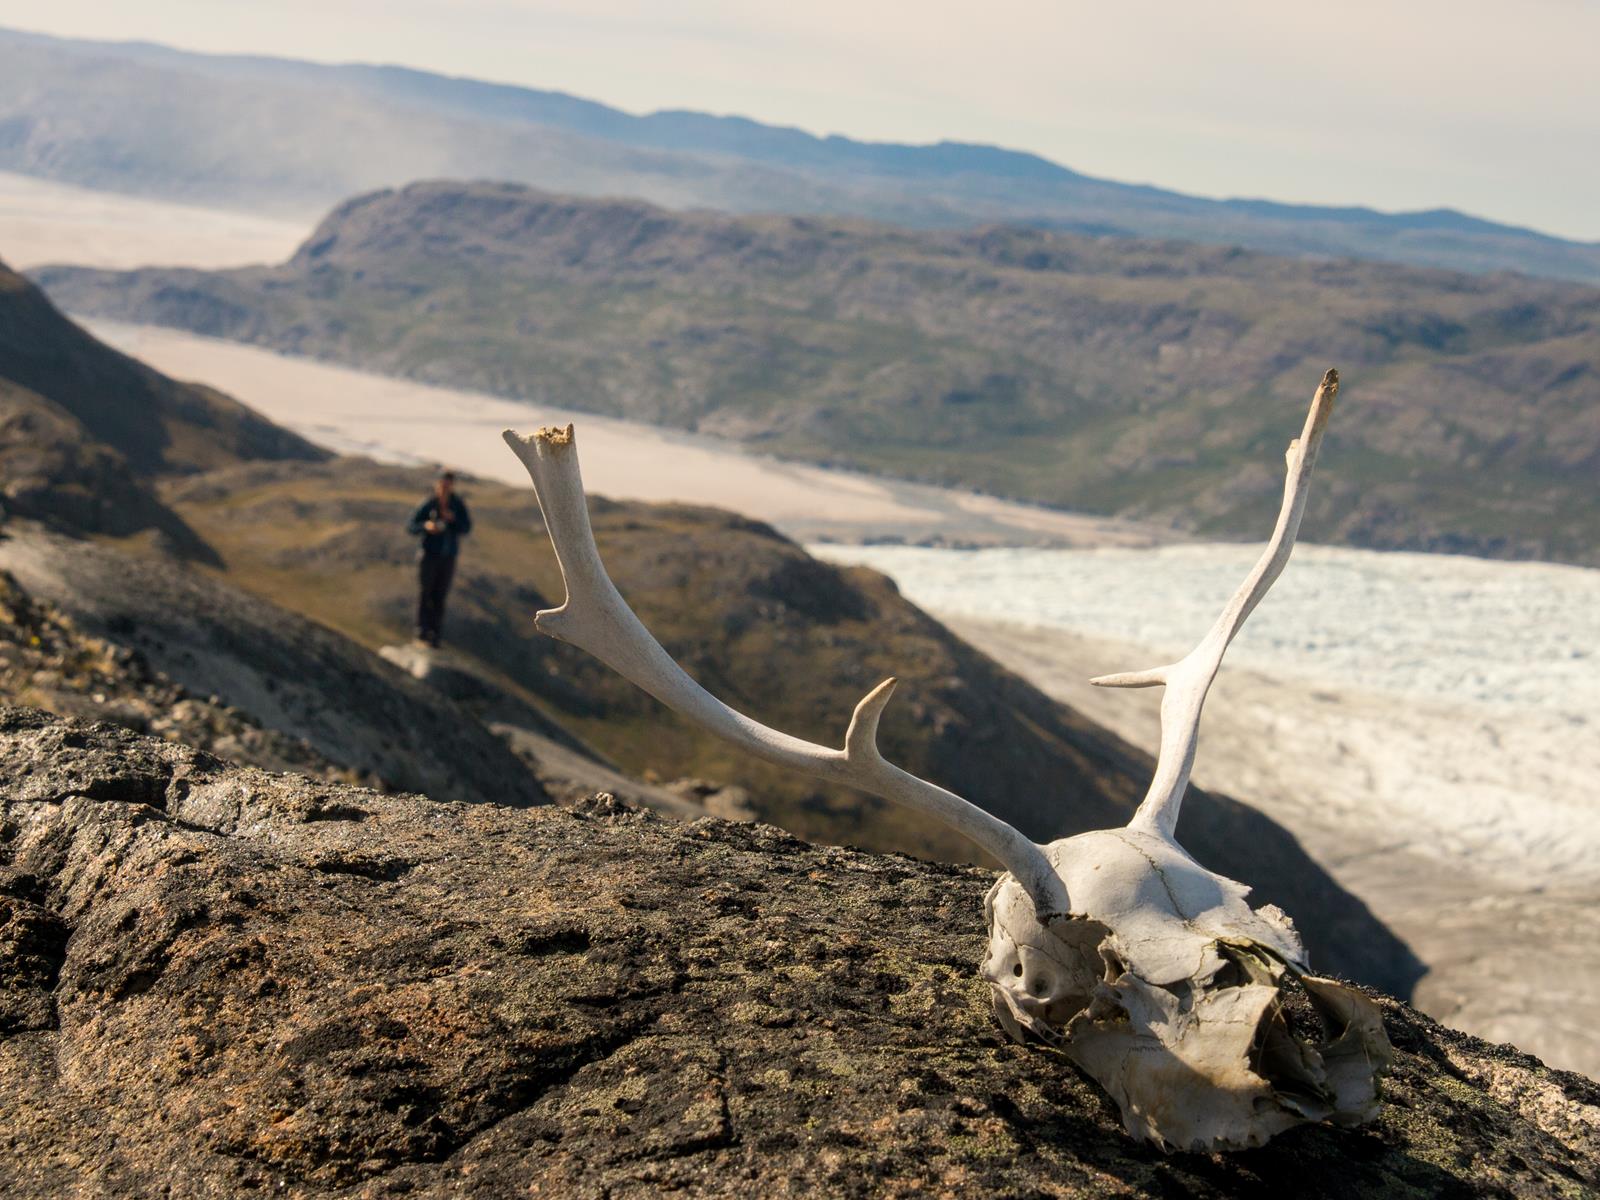
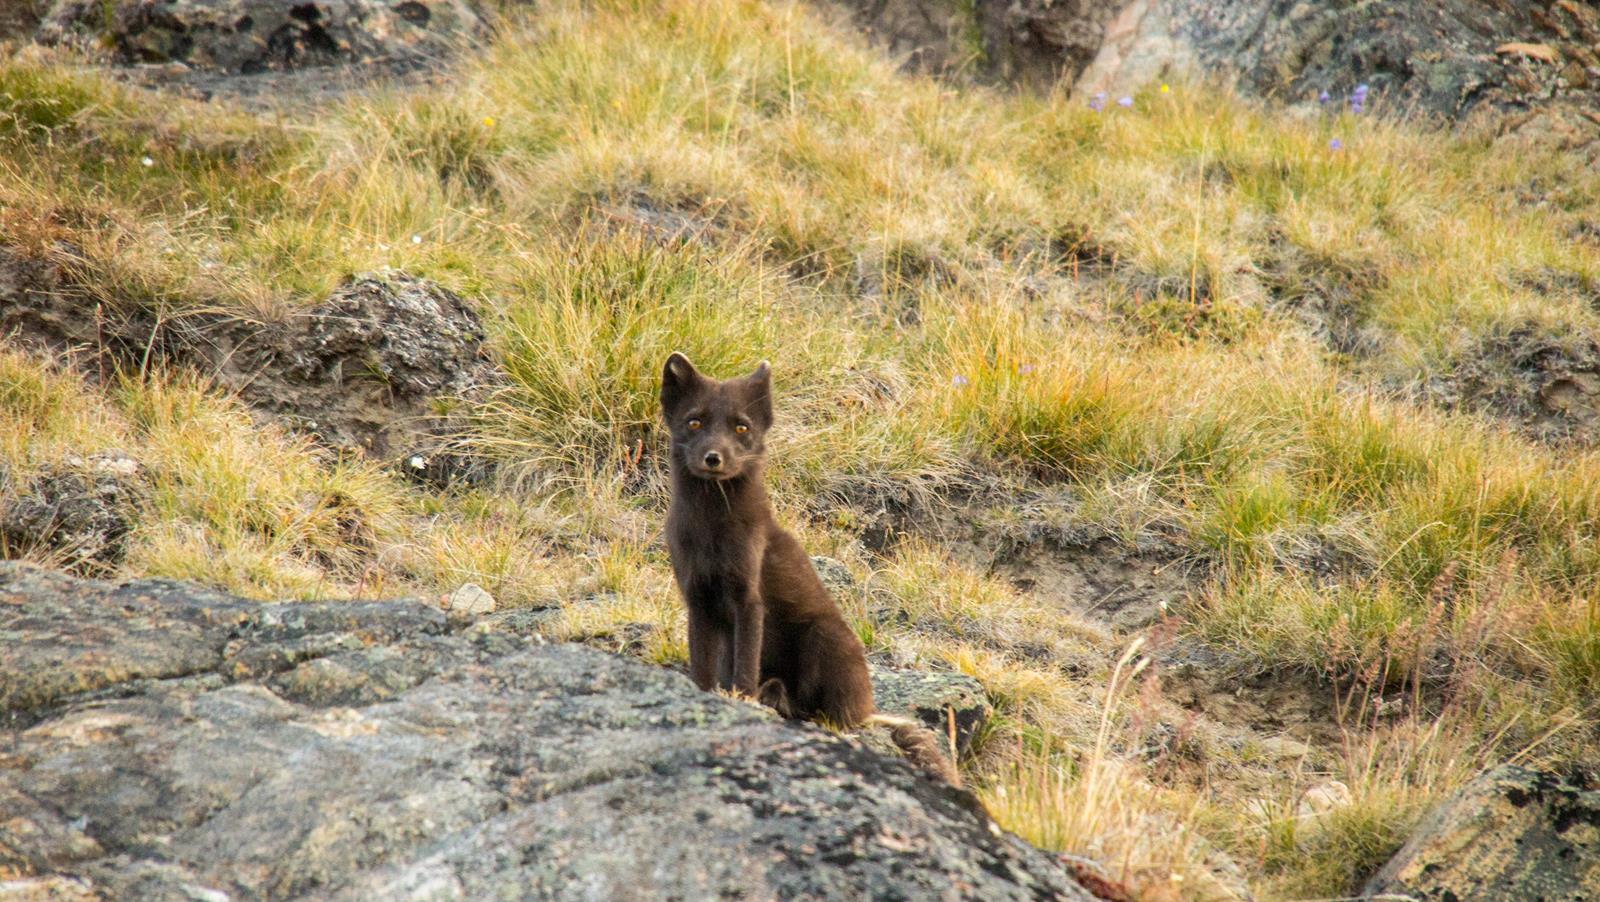
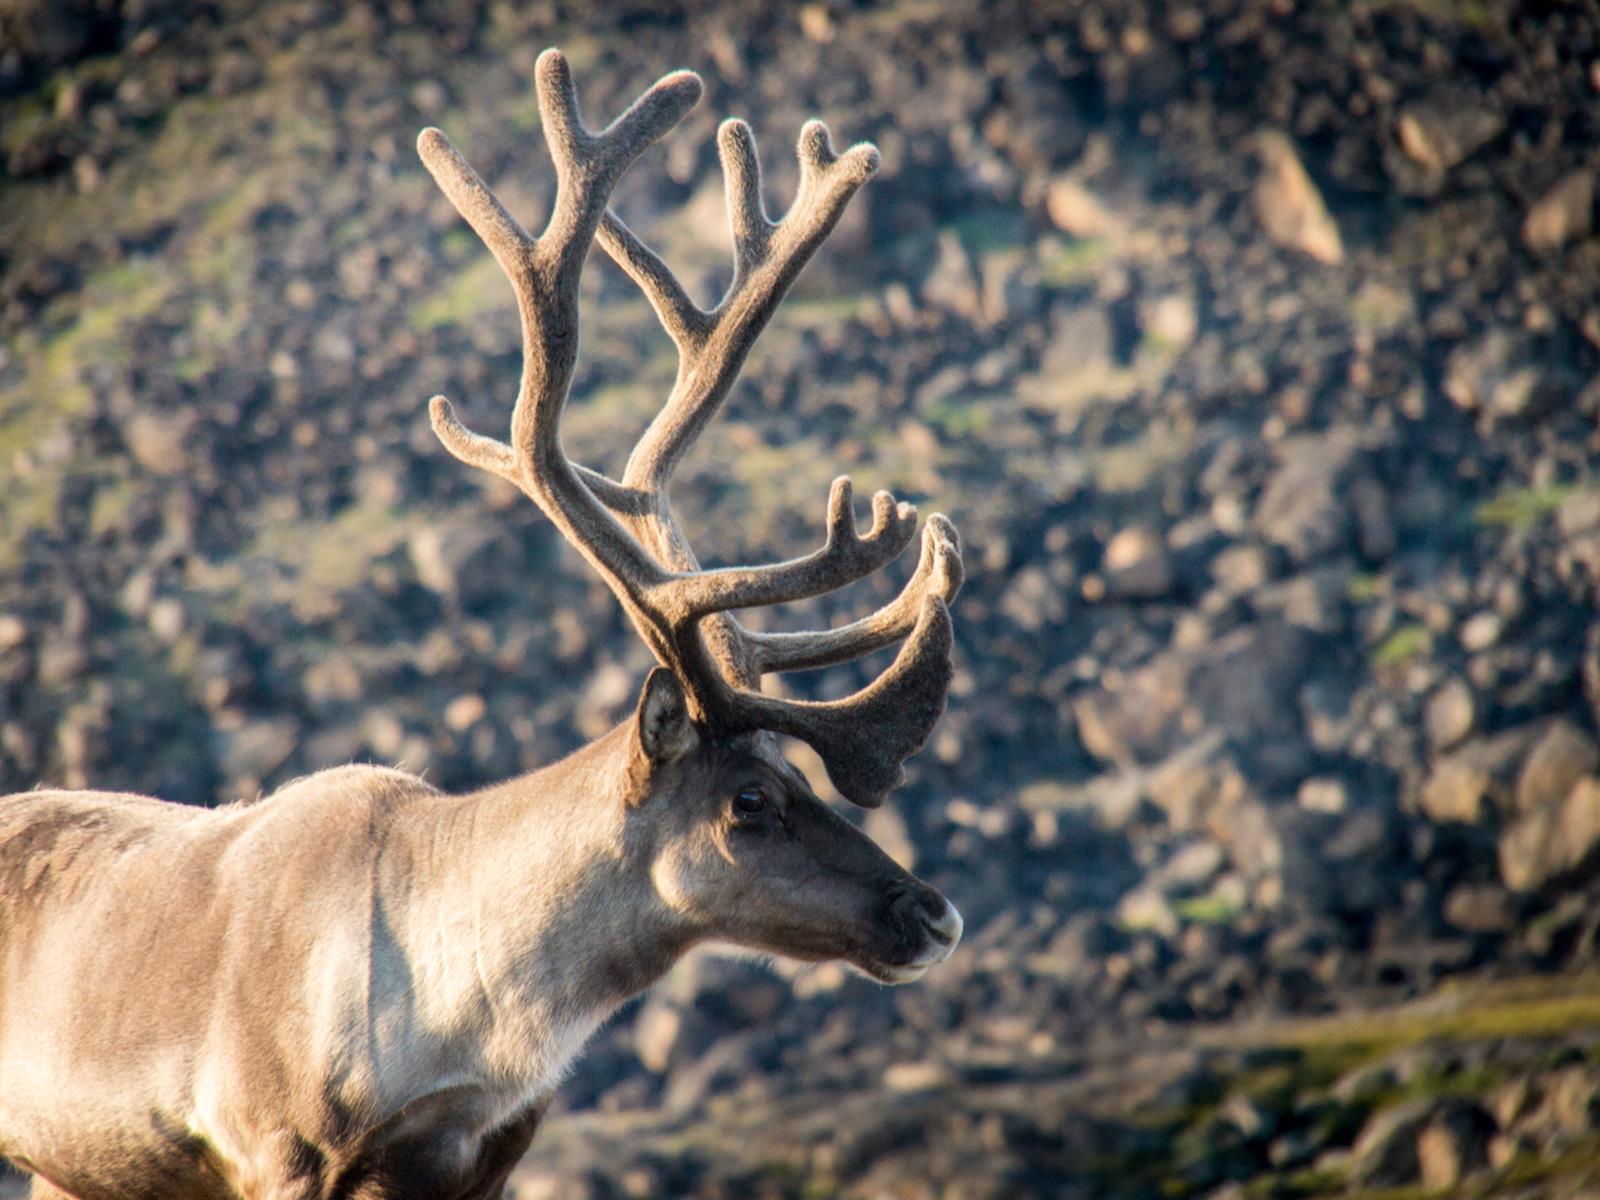
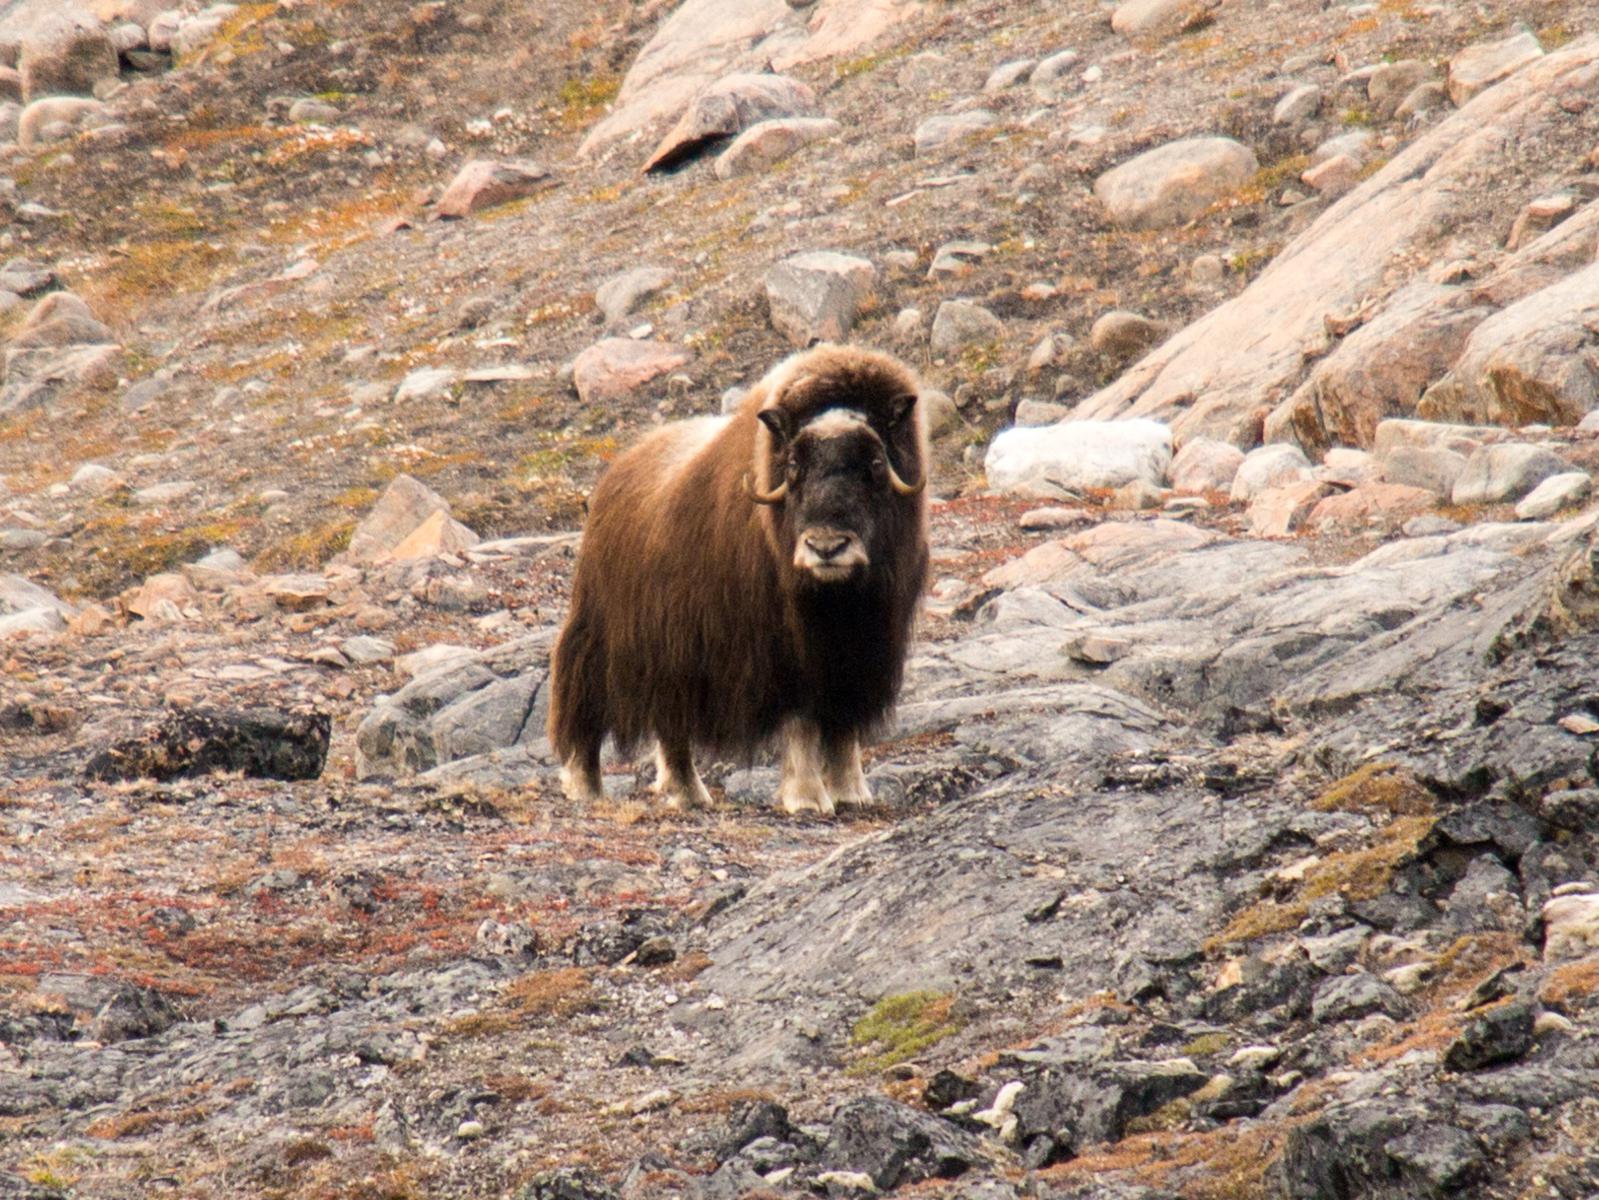
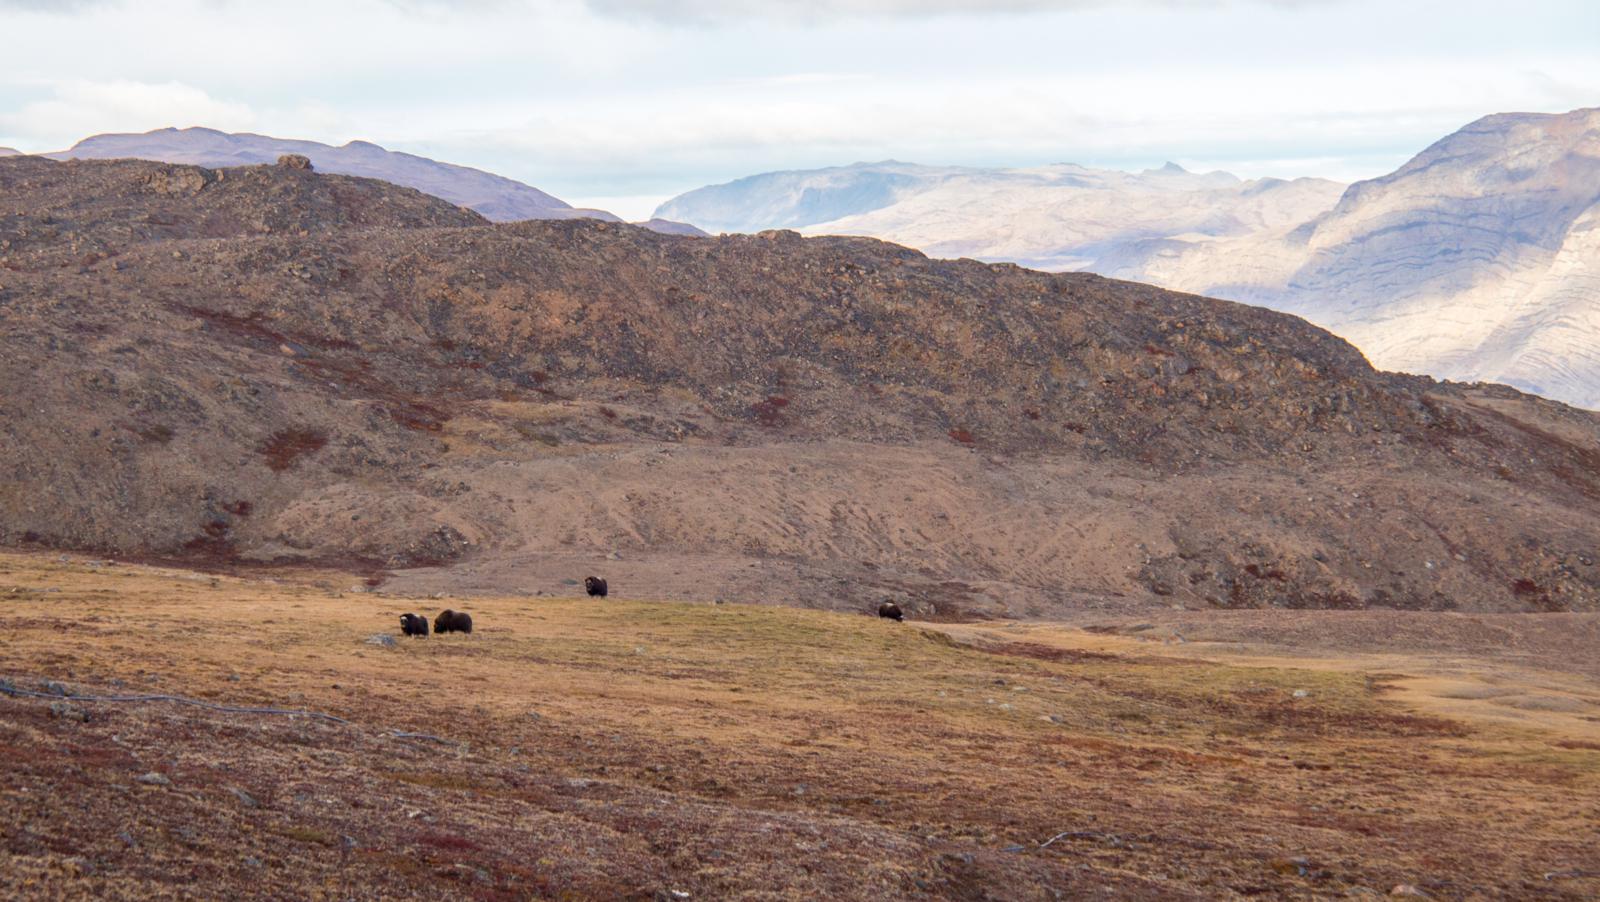
During those last days, the variety and number of fauna I encounter on the way are impressive: countless arctic hare, reindeer and muskoxen dot the rocky tundra on this forgotten strip of land seperating the ice sheet from the icy waters of the Davis Strait. Slalomming through herds of muskoxen, carefully climbing across moraines and boulderfields not to surprise aggressive bulls, was an extremely powerful sensation – a sensation where I did no longer feel like a spectator in the wilderness, but like an integral part of it, obeying to the same laws of nature as any other animal out there.
As I reach Kangerlussuaq on a cold, wet and windy september morning, my passion for Greenland – its people, its spectacular natural richness and variety, the crisp clear sky bound by the ice sheets on a distant horizon, the cottongrass-bearded ponds and streams, the vast wind-swept plateaus and the intimity of lush green valleys, the roar of meltwater thundering through mineral alpine winderness, the whisper of icebergs sailing through the fjords, the ghostly shadows of the northern lights dancing through the arctic night, the sun clinging ever closer to the safety of the horizon on the approach of a new winter, and the sheer, most ancient human pleasure of travelling through unknown and mysterious landscapes – has crystallized into a love more pure and profound than I could have deemed possible for any place.
Paddling in the upper Eternity fjord
Beaching my packraft at the tip of Eternity fjord
Climbing away from Eternity Fjord
I travelled through an extremely remote valley for the next 25km – encountering my first muskoxen of the trip on the way
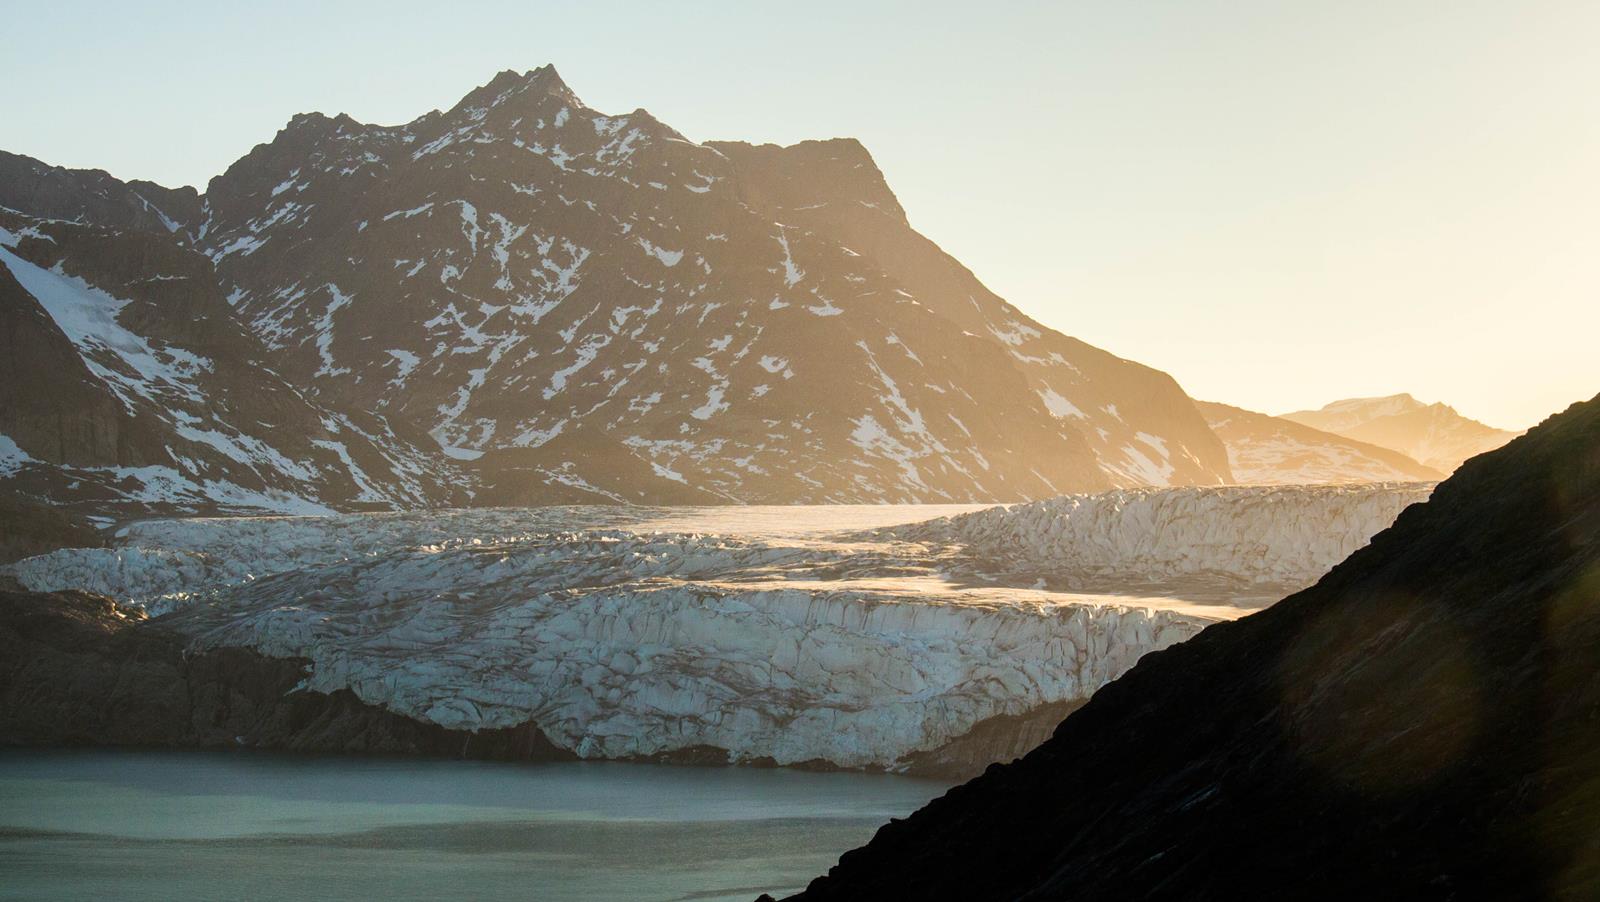
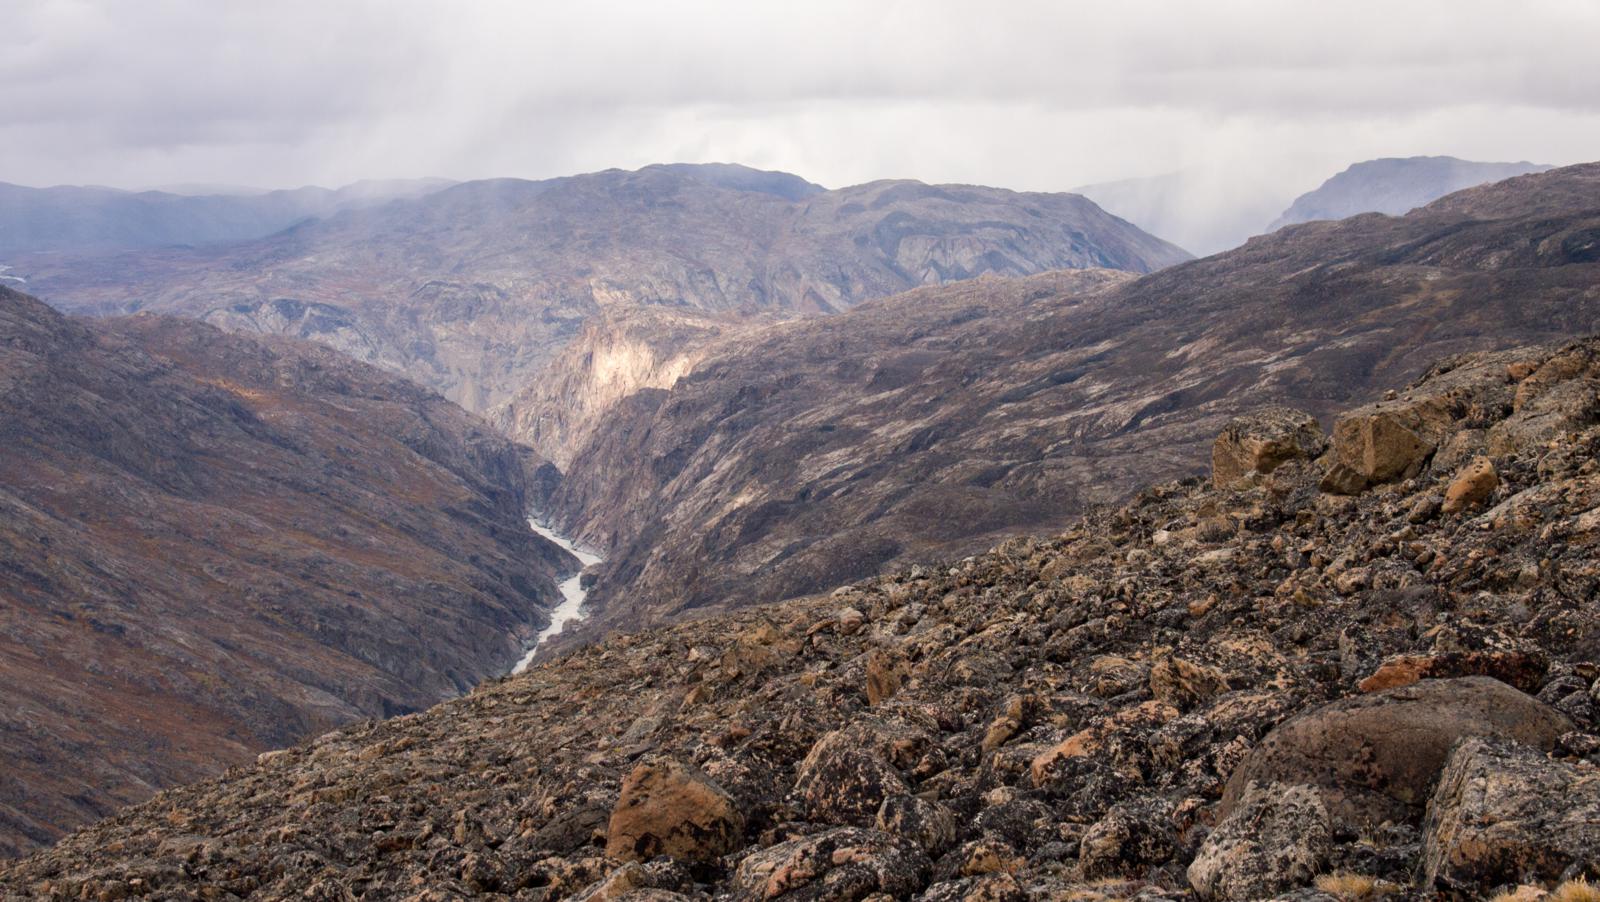
The valley I travelled through is squeezed between two ice sheets, with countless outlet glacier diving down into the valley on many places.
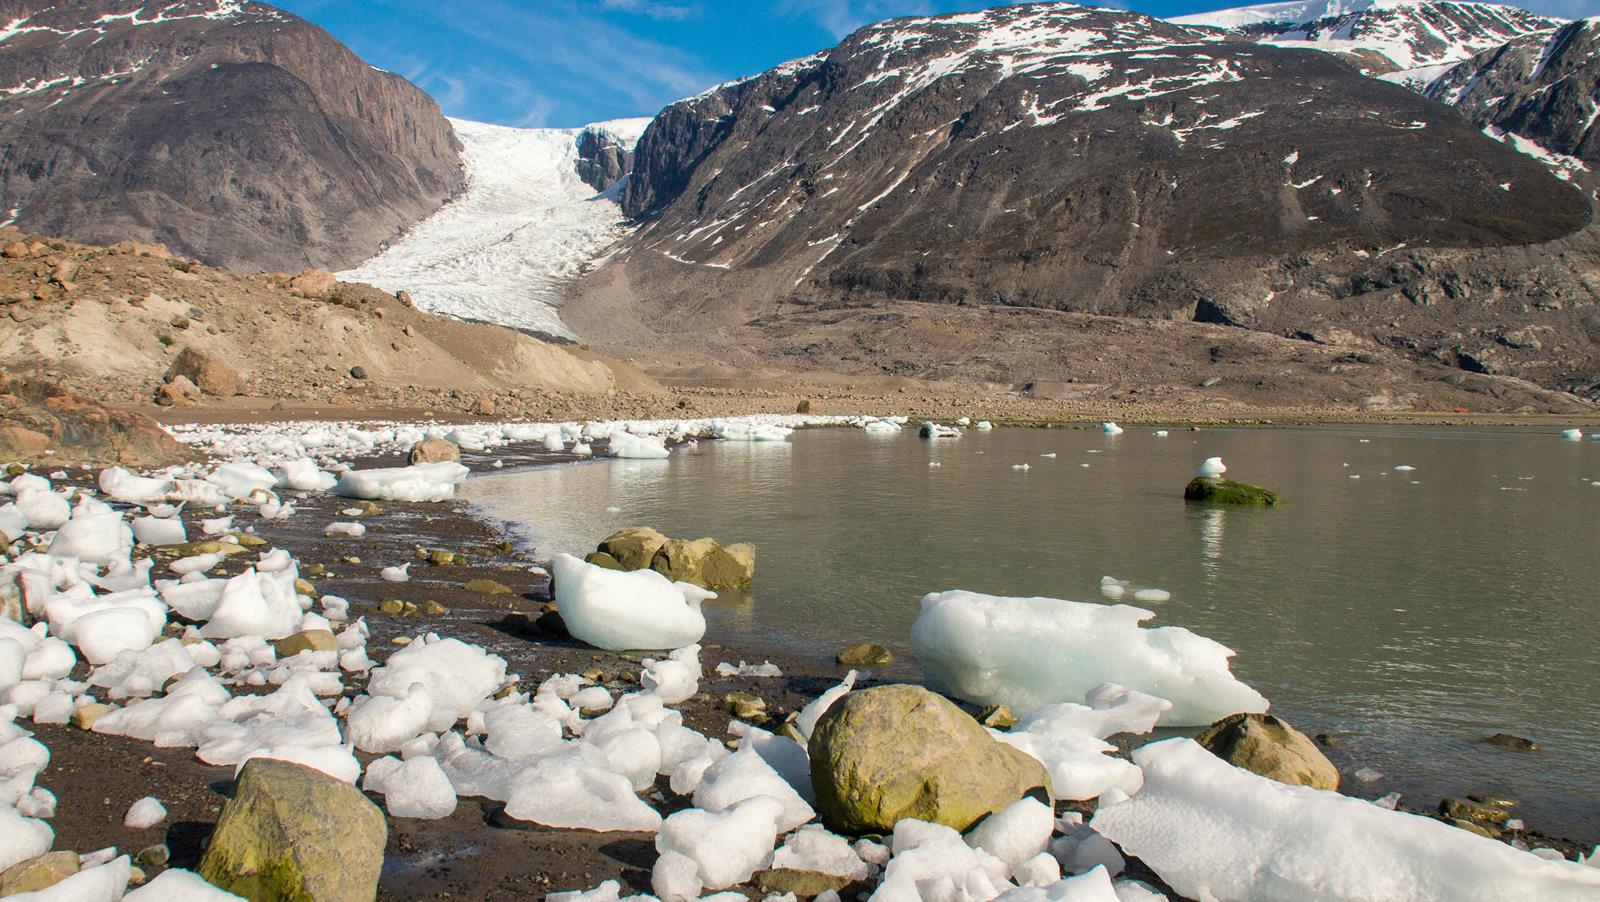
One of the outlet glaciers diving into the valley, and calving iceberg into a proglacial lake.
One of the outlet glaciers diving into the valley, and calving iceberg into a proglacial lake.
The glaciers in this area are retreating at an alarming pace. This one dives down all the way to a proglacial lake on Google Earth images from 2014. Now it had already retreated over 100m from the lake. Instead of using my packraft to bypass the glacier front on the lake, I could ford the icy meltwater stream
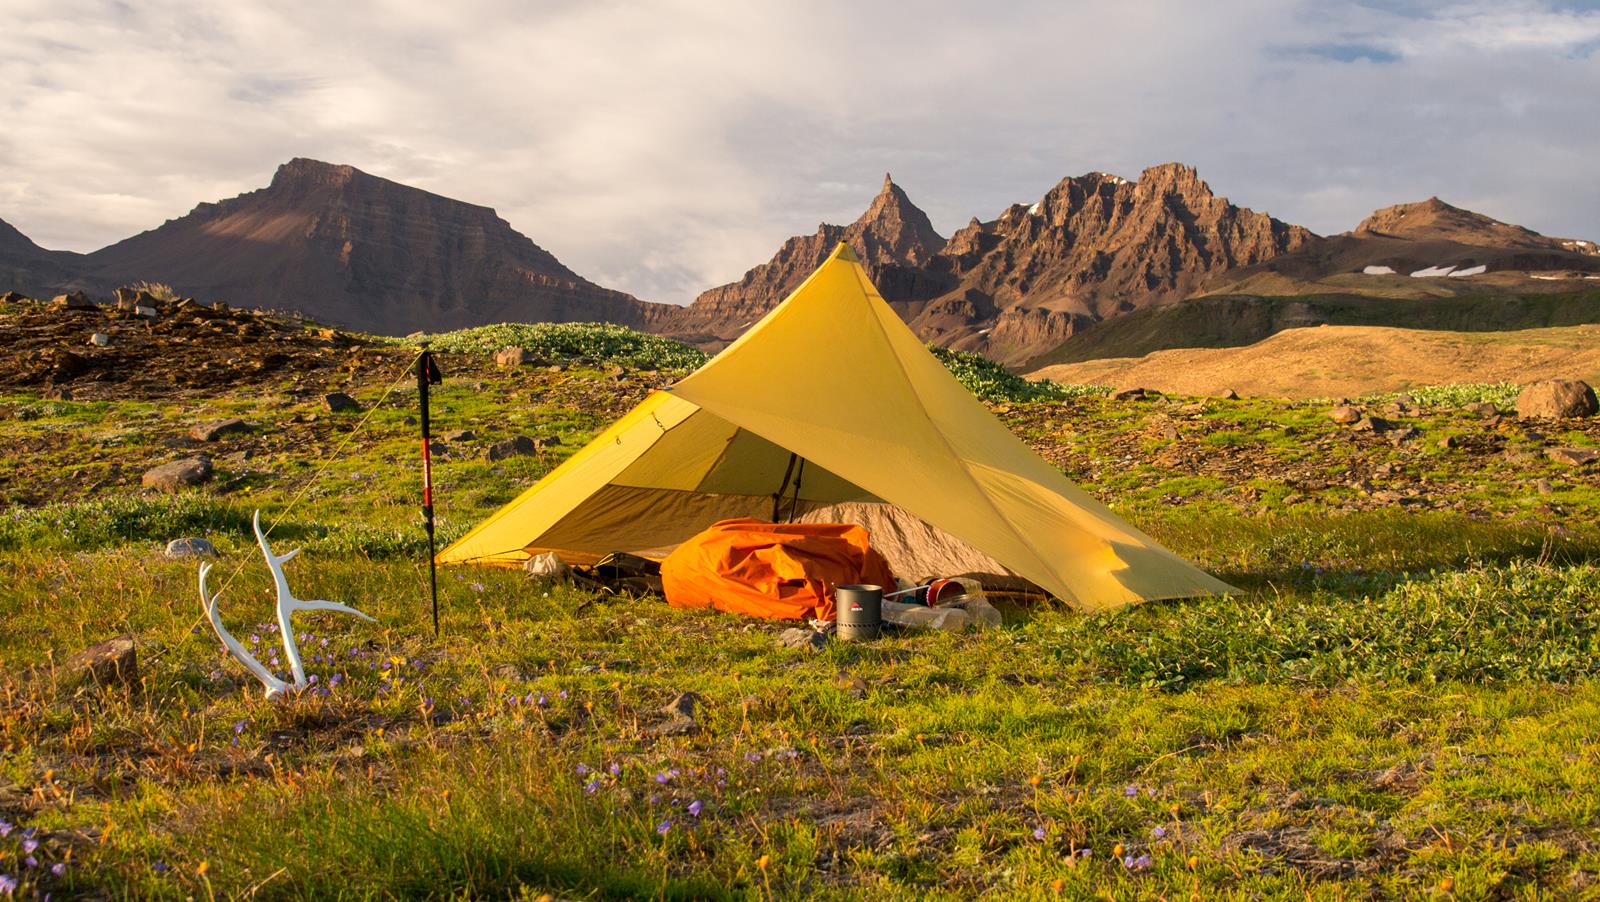
Evening splendour.
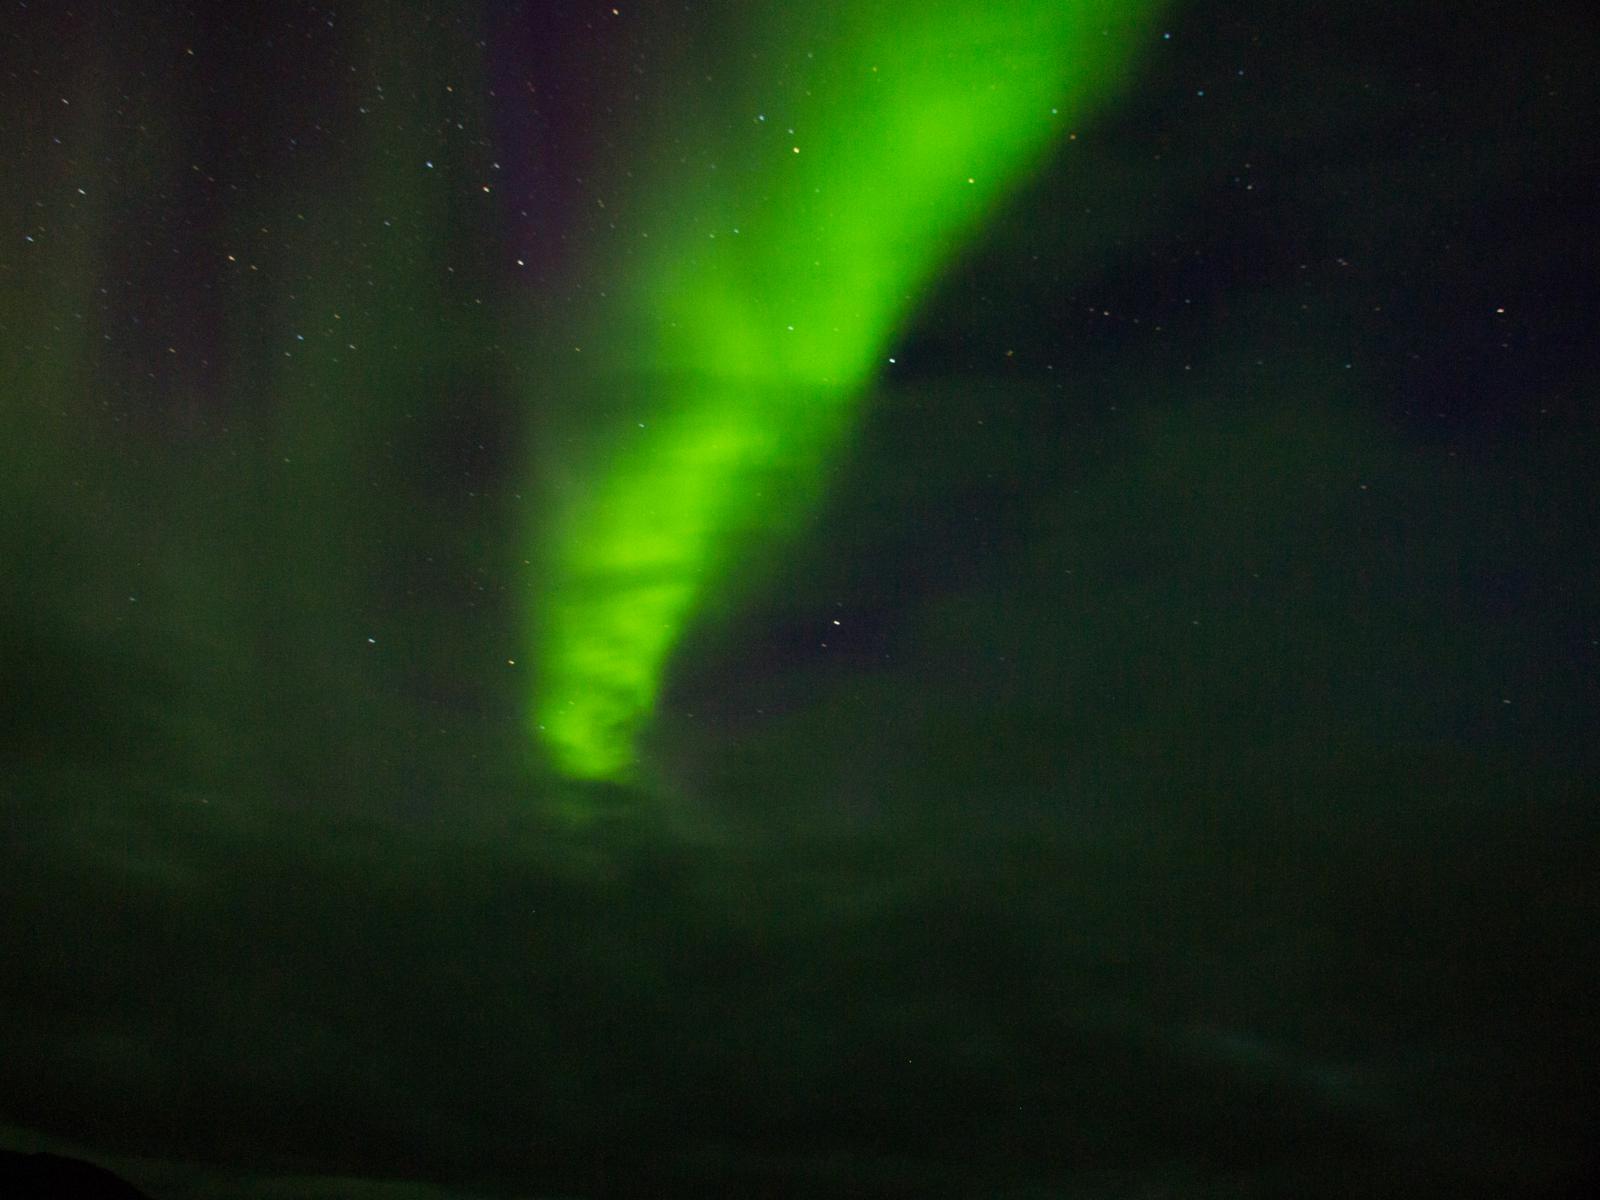
While camping in the valley, I had my most active aurora display of the trip.
While camping in the valley, I had my most active aurora display of the trip.
Climbing out of the valley on boulders.
Looking back through the valley, and all the way into Eternity fjord.
As soon as I made it up the vast plateaus, I started encountering muskoxen pretty much every single kilometer.
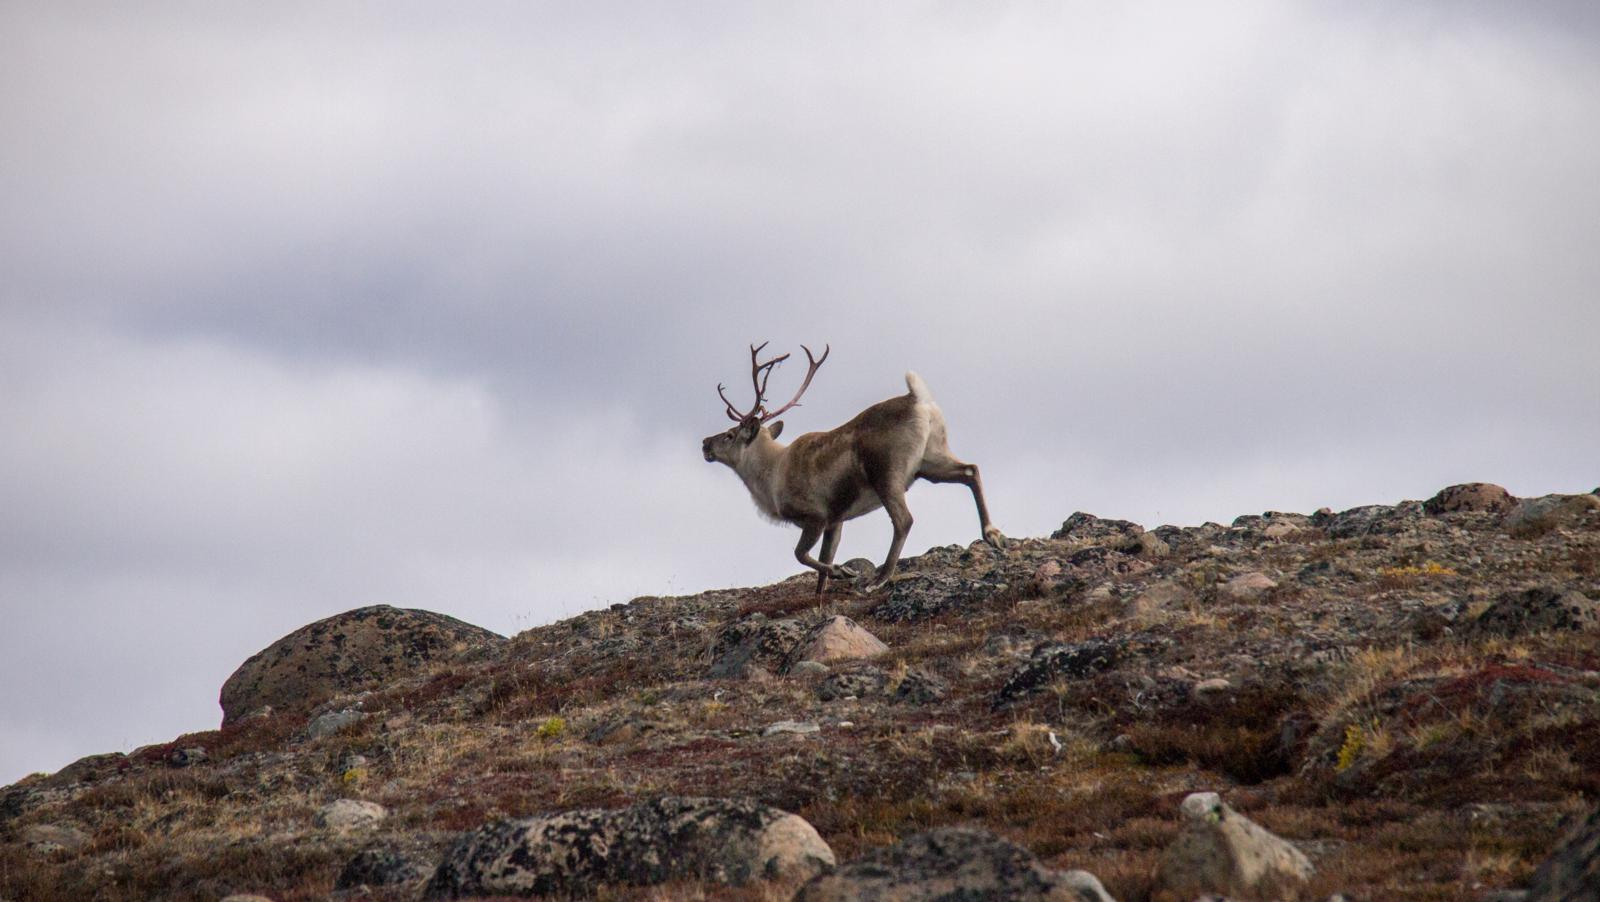
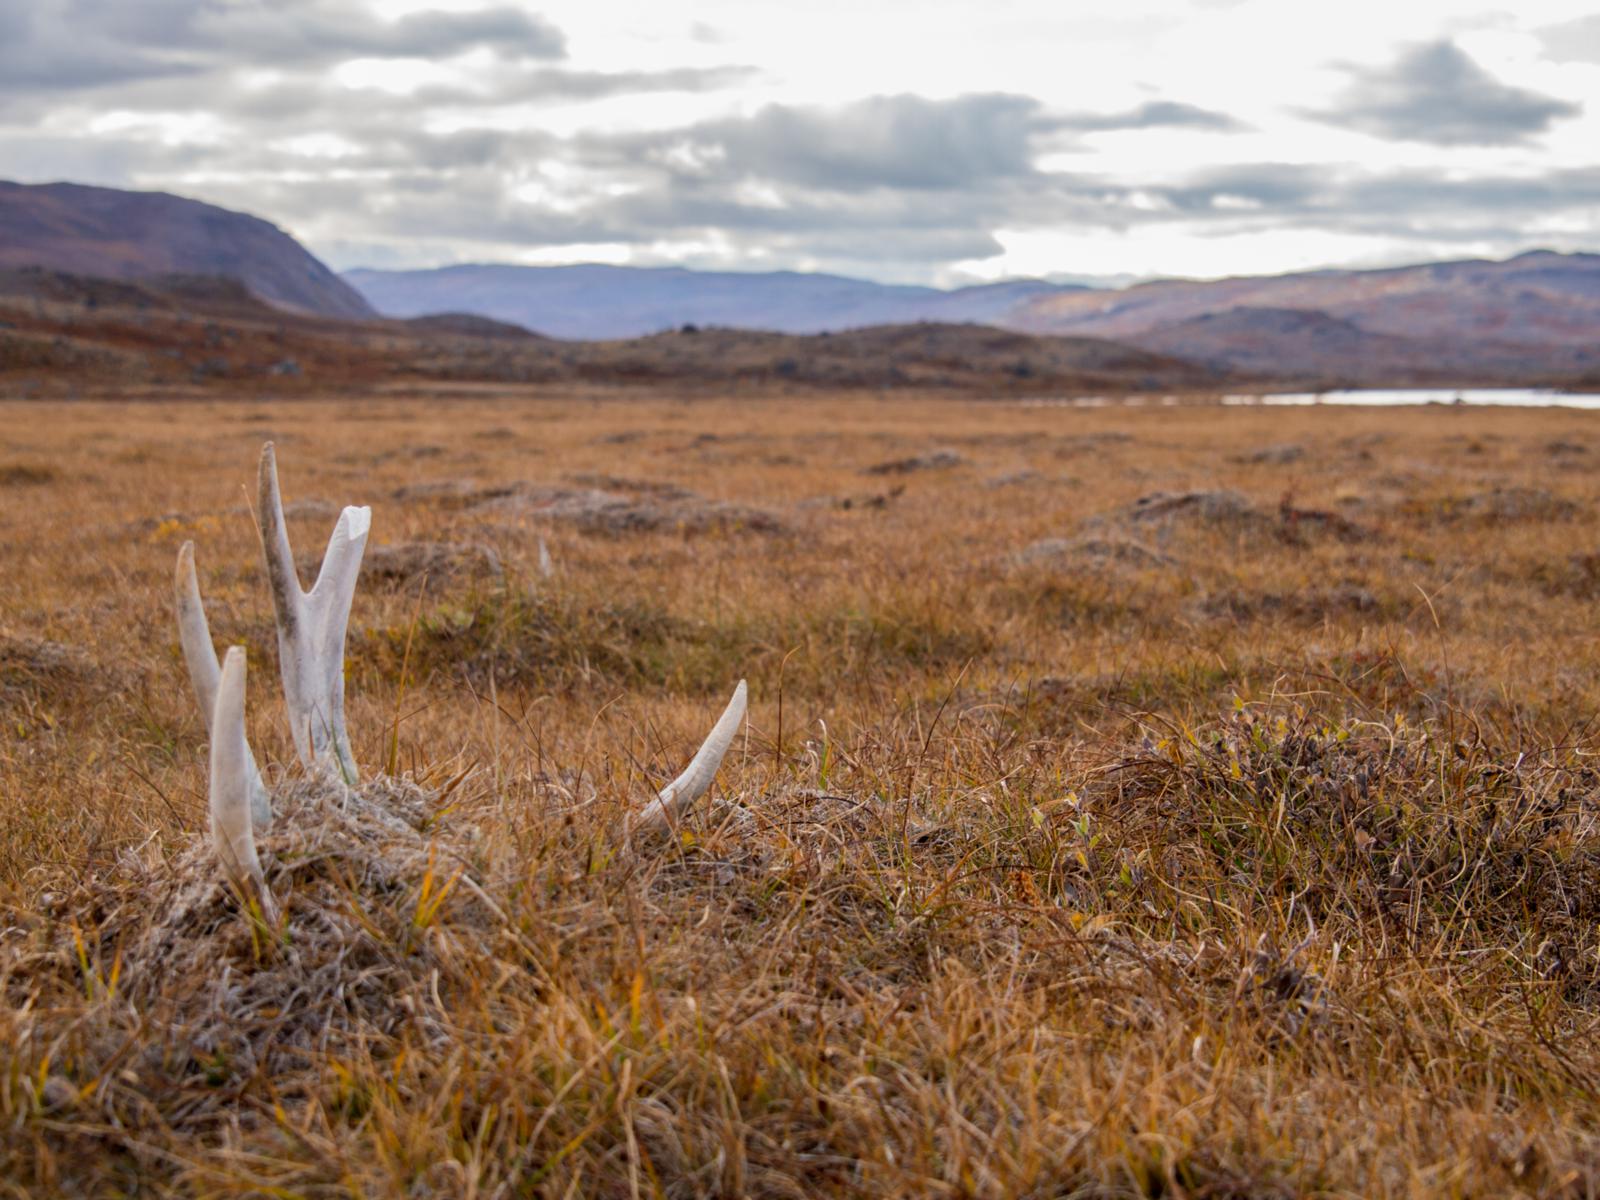
Reindeer were also present in big numbers.
The muskoxen typically roamed on the tundra in groups of 4-8 animals.
Paddling across a lake on my way north across the plateaus.
The weather finally grew cold and dull during this part of the trip, with temperatures hovering just above freezing. It seemed to make the arctic hare, which were impossible to approach earlier during the trip, switch to an energy-saving mode where they did no longer bother about my presence.
Arctic hare on the way to Kangerlussuaq
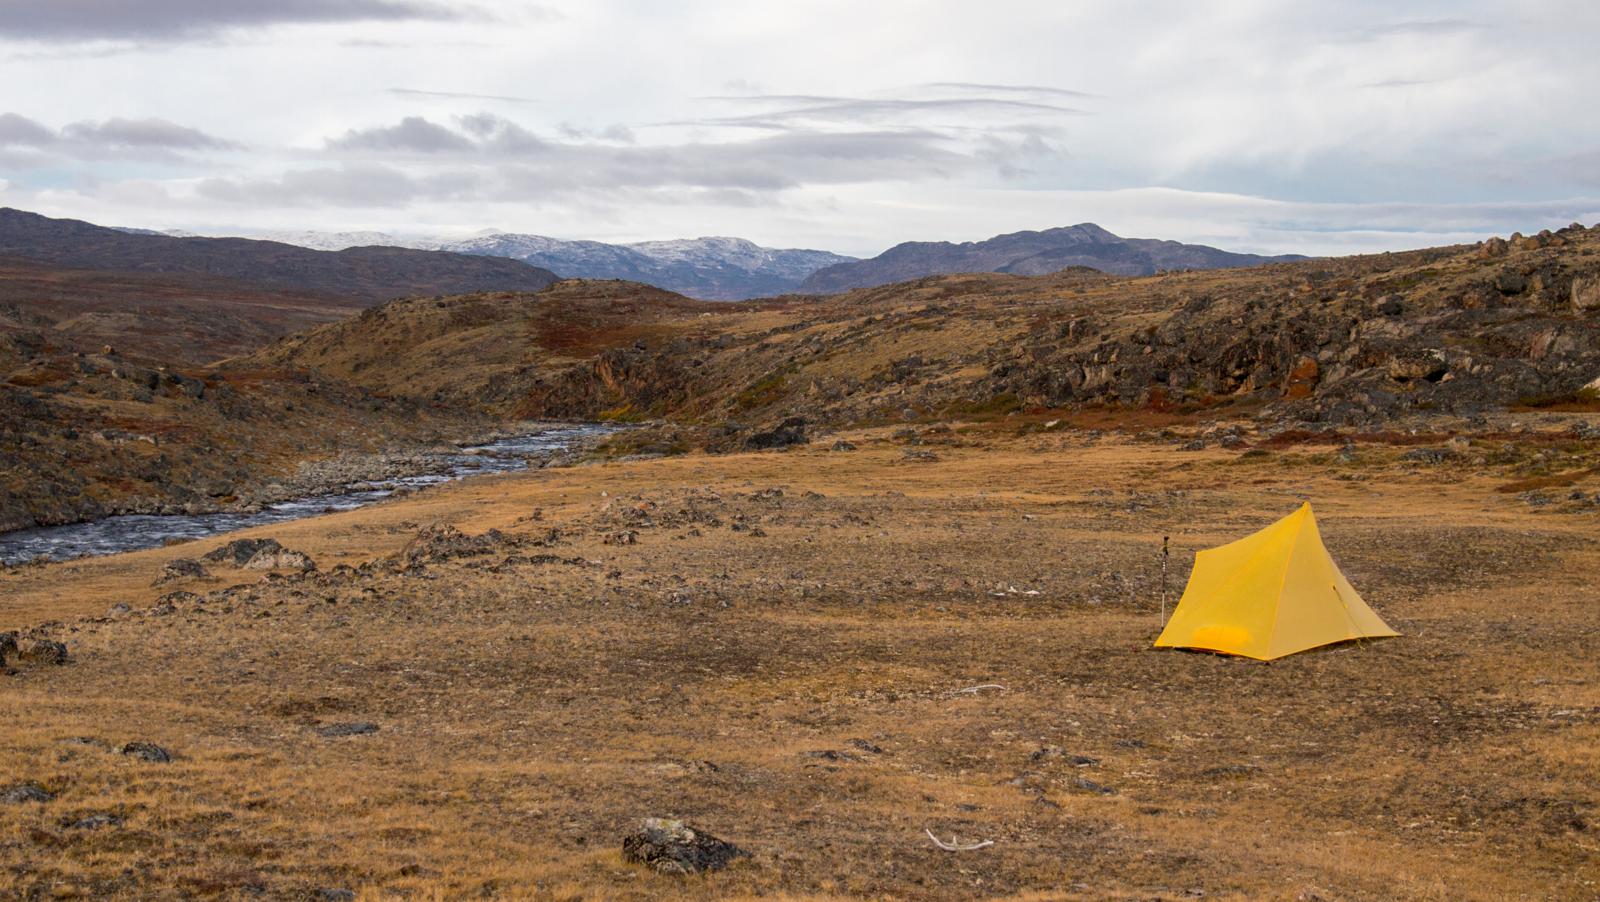
Bivy along the lake
I had a long, high section on a day with regular showers of rain and sleet. Visibility was often limited, making orientation exciting with just my 1/250000 Saga map.
More actic hare
More actic hare
Bivy along a smaller river on the plateaus.
Still spotting countless muskoxen.
Descending into the splendid Paradise Valley. The amount of muskoxen in this valley was impressive – I spotted about 300 on a single day.
The going through the Paradise Valley was incredible – flat, dry terrain without boulders or bush!
Arctic desert in Paradise Valley
Hiking across the plateaus
Time.
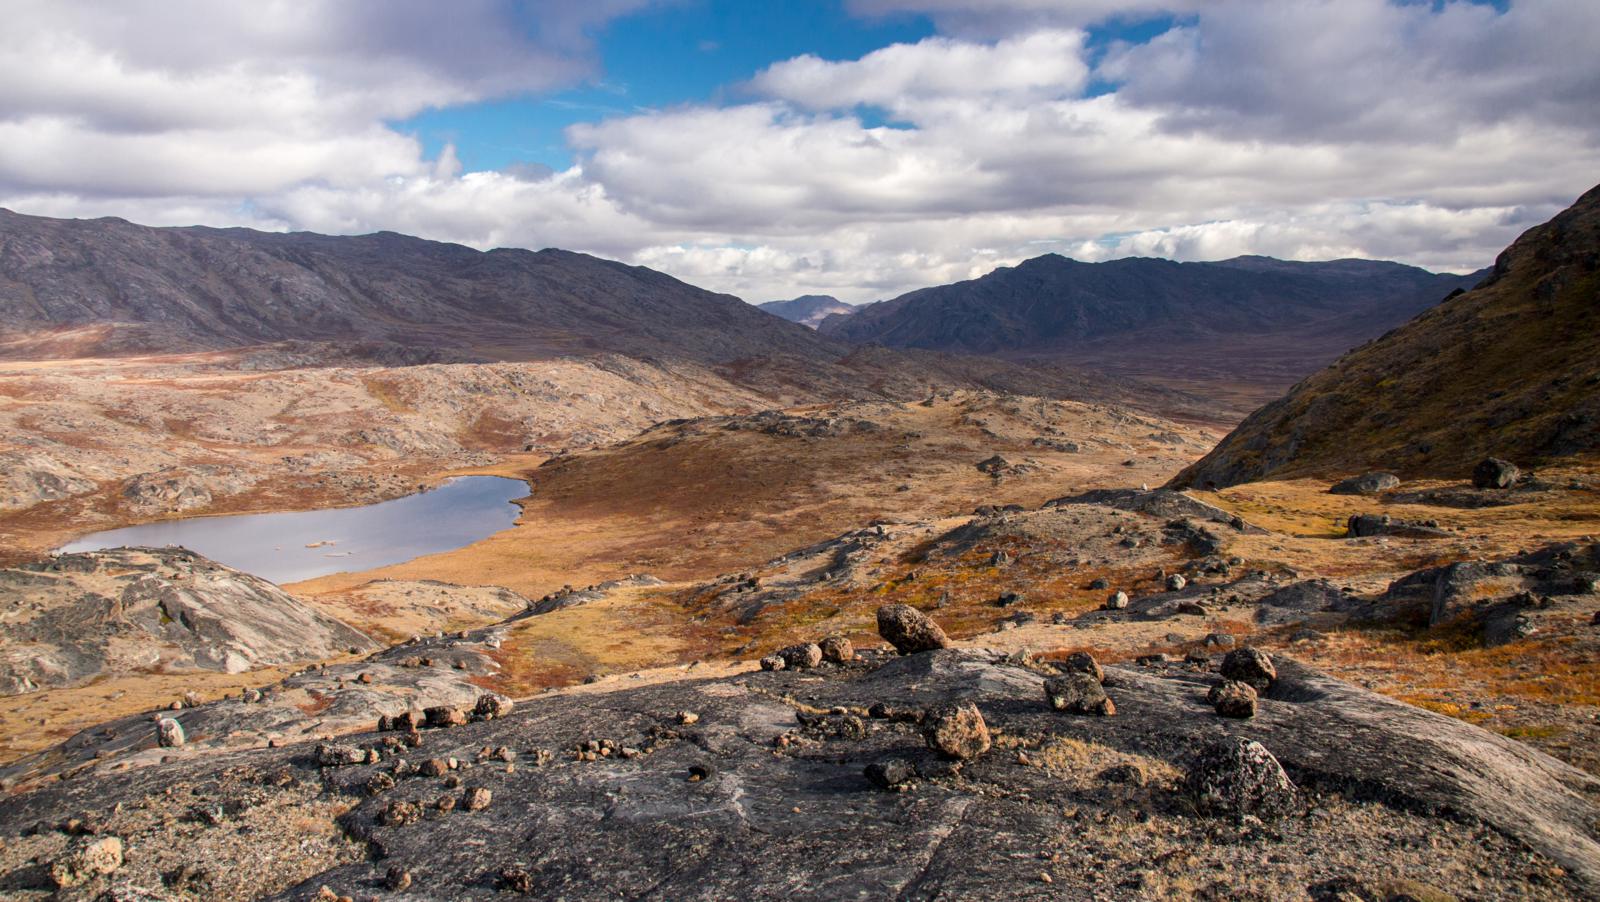
Camping along the shores of one of the countless lakes on the plateaus.
I had some aurora displays through the Sc-sheets during the night.
Morning sun on the last long day of the trip.
Reaching the outflow of Lake Tasersuaq.
I paddled about 14km on Lake Tasersuaq to reach the northern shore. It was the last day of the 2016 summer in West Greenland.
Taking a short break along lake Tasersuaq.
Continuing the 14km paddling section on Lake Tasersuaq.
Climbing away from the vast Tasersuaq Lake.
Reaching Sondre Stromfjord!
Descending to Sondre Stromfjord on a splendid september afternoon.
Beaches along the Sondre Stromfjord
Preparing for a long packraft crossing of Sondre Stromfjord in perfect conditions.
Climbing away from Sondre Stromfjord at the end of a 36km-day, making the best of the splendid september weather.
Almost sunset, almost there.
Northern lights near Kangerlussuaq – I stayed awake that evening waiting for the northern lights. A warm front kicked in from the west around midnight, ending the fun.
Descending to Kangerlussuaq in the worst weather of the entire trip: cold, wet and windy.
Hasta pronto Greenland!
DISCLAIMER:
This Greenland trip offered the purest, most pristine wilderness I have ever travelled through. I want it to remain that way. Therefore I have not included geographical references in my report. Whilst this might sound a bit egoistic, I’m sure experienced wilderness travellers will be able to design their own route – the possibilities are virtually endless!
I have received many messages asking for more details about my trip. Without underestimating anyone’s abilities, I want to point out that this was the most difficult trip I have ever made. The terrain was often harsh, with relentless boulderfields, moraine, serious river fordings, peat bogs, and quicksands near glaciers close to the ice sheets. There are no trails, no huts, or any other facilities for hikers along this route, and topographic maps are virtually inexistent for much of it (I used the 1/250000 Saga maps for over half of my trajectory). Backpack weight is heavy because of the lack of resupply options, I started with about 32-33kg despite using ultralight gear – but I tend to eat a lot! To packraft the fjords, one should have a good insight in the dynamics of tidal currents, (fjord)winds, katabatic winds, and how they interact in creating waves. If you are not able to fully assess these risks, or are not mentally prepared for the difficult terrain, you won’t have a lot of fun in the first place, and may end up in dangerous situations which I don’t want to be held responsible for in any way.